OPEN-SOURCE SCRIPT
VolumeMA
VolumeMA
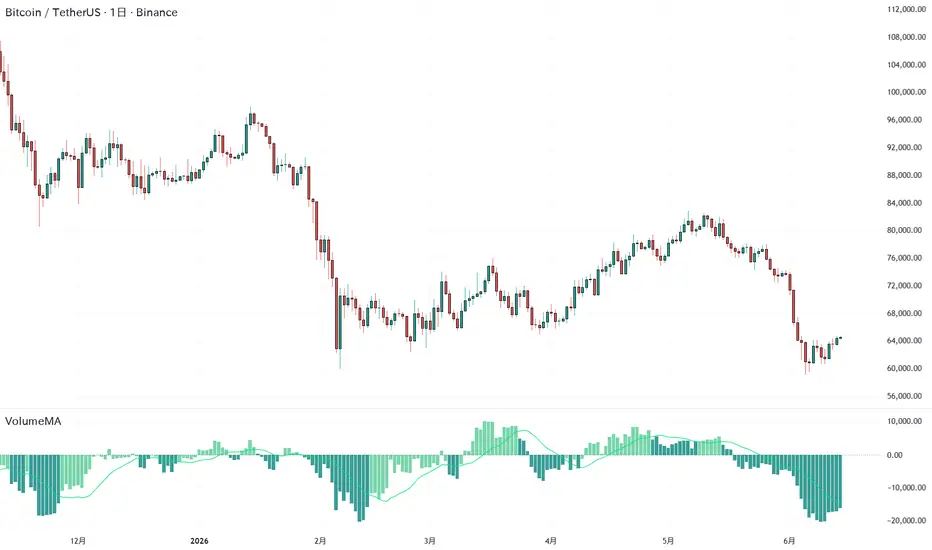
VolumeMA is a volume-based indicator designed to visualize market participation by combining trading volume with price direction.
Unlike traditional volume indicators that display only raw volume, VolumeMA assigns positive volume to rising price bars and negative volume to falling price bars. This helps traders identify whether buying or selling pressure is dominating the market.
The indicator smooths these values using a moving average, reducing short-term noise and making underlying market participation easier to observe.
Features
Directional Volume
Volume is assigned based on price movement:
* Rising price bar → Positive volume
* Falling price bar → Negative volume
This allows traders to quickly identify whether buyers or sellers are currently in control.
Volume Moving Average
The directional volume is smoothed using a Simple Moving Average (SMA), creating the Volume Moving Average histogram.
This helps highlight trends in market participation rather than focusing on individual volume spikes.
SMA Signal Line
An additional SMA is applied to the Volume Moving Average.
When the Volume Moving Average is above its SMA, market participation is considered relatively strong.
When it is below its SMA, market participation is considered relatively weak.
Zero Line
The zero line separates bullish and bearish volume pressure:
* Above zero → Buying pressure dominates
* Below zero → Selling pressure dominates
Color Visualization
Histogram colors automatically change depending on whether the Volume Moving Average is above or below its SMA, making shifts in momentum easier to identify.
Usage
VolumeMA is designed as a complementary tool for market analysis. It can be used alongside price action, trend analysis, and other indicators to better understand market participation and momentum.
As with any indicator, it should not be used in isolation and does not guarantee future performance.
VolumeMA is a volume-based indicator designed to visualize market participation by combining trading volume with price direction.
Unlike traditional volume indicators that display only raw volume, VolumeMA assigns positive volume to rising price bars and negative volume to falling price bars. This helps traders identify whether buying or selling pressure is dominating the market.
The indicator smooths these values using a moving average, reducing short-term noise and making underlying market participation easier to observe.
Features
Directional Volume
Volume is assigned based on price movement:
* Rising price bar → Positive volume
* Falling price bar → Negative volume
This allows traders to quickly identify whether buyers or sellers are currently in control.
Volume Moving Average
The directional volume is smoothed using a Simple Moving Average (SMA), creating the Volume Moving Average histogram.
This helps highlight trends in market participation rather than focusing on individual volume spikes.
SMA Signal Line
An additional SMA is applied to the Volume Moving Average.
When the Volume Moving Average is above its SMA, market participation is considered relatively strong.
When it is below its SMA, market participation is considered relatively weak.
Zero Line
The zero line separates bullish and bearish volume pressure:
* Above zero → Buying pressure dominates
* Below zero → Selling pressure dominates
Color Visualization
Histogram colors automatically change depending on whether the Volume Moving Average is above or below its SMA, making shifts in momentum easier to identify.
Usage
VolumeMA is designed as a complementary tool for market analysis. It can be used alongside price action, trend analysis, and other indicators to better understand market participation and momentum.
As with any indicator, it should not be used in isolation and does not guarantee future performance.
오픈 소스 스크립트
트레이딩뷰의 진정한 정신에 따라, 이 스크립트의 작성자는 이를 오픈소스로 공개하여 트레이더들이 기능을 검토하고 검증할 수 있도록 했습니다. 작성자에게 찬사를 보냅니다! 이 코드는 무료로 사용할 수 있지만, 코드를 재게시하는 경우 하우스 룰이 적용된다는 점을 기억하세요.

면책사항
해당 정보와 게시물은 금융, 투자, 트레이딩 또는 기타 유형의 조언이나 권장 사항으로 간주되지 않으며, 트레이딩뷰에서 제공하거나 보증하는 것이 아닙니다. 자세한 내용은 이용 약관을 참조하세요.
오픈 소스 스크립트
트레이딩뷰의 진정한 정신에 따라, 이 스크립트의 작성자는 이를 오픈소스로 공개하여 트레이더들이 기능을 검토하고 검증할 수 있도록 했습니다. 작성자에게 찬사를 보냅니다! 이 코드는 무료로 사용할 수 있지만, 코드를 재게시하는 경우 하우스 룰이 적용된다는 점을 기억하세요.
면책사항
해당 정보와 게시물은 금융, 투자, 트레이딩 또는 기타 유형의 조언이나 권장 사항으로 간주되지 않으며, 트레이딩뷰에서 제공하거나 보증하는 것이 아닙니다. 자세한 내용은 이용 약관을 참조하세요.