GC 12 Levels + Basis Dashboard V2.4
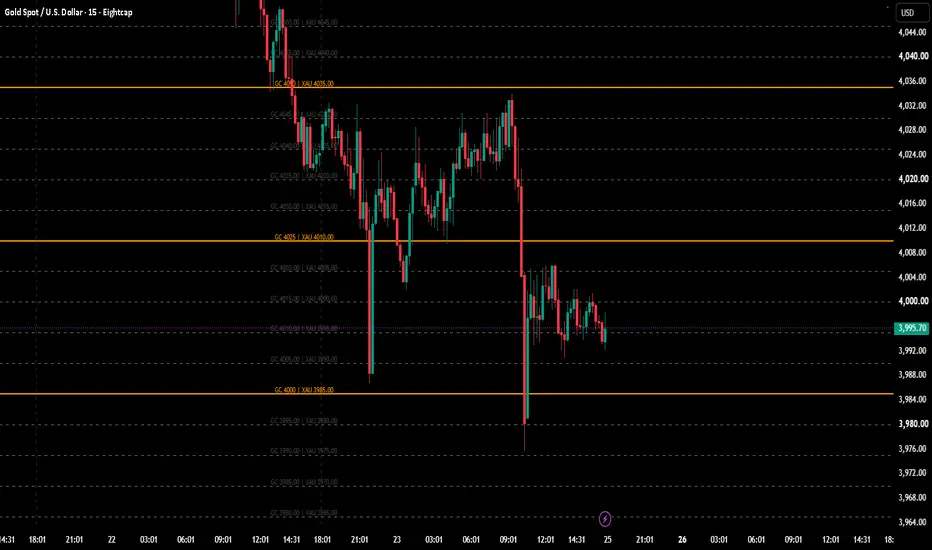
**GC 12 Levels + Basis Dashboard — V2.4**
This indicator maps GC gold futures price levels onto an XAUUSD chart using a manually defined, fixed basis. It combines 12 main levels, optional dashed subdivisions, and a dashboard for monitoring the futures–spot price difference.
**Main Features**
- **12 main levels:** Automatically generated from a GC starting price and a spacing value.
- **Dashed minor levels:** Divide each main interval into equal parts. The default setting of 10 parts creates 9 minor lines between adjacent main levels.
- **Price labels:** Main levels display GC and XAU prices. Minor labels can display XAU, GC, or both.
- **Display controls:** Show or hide individual main levels, toggle minor lines and their labels, and adjust colors, line widths, transparency, text size, and text position.
- **Basis dashboard:** Displays futures and spot prices, market basis, annualized basis, an interest-based fair basis estimate, Z-score, percentile, and basis status.
**How to Set Up**
1. Add the indicator to a standard XAUUSD candlestick chart.
2. Enter **GC starting price (Level 1)** for the lowest main level.
3. Set **GC spacing** to define the distance between main levels.
4. Enter **Fixed Basis for 12 Levels (GC − XAU)**.
5. Under **Minor Levels**, enable dashed levels and choose **Parts per main interval**.
6. Select **GC | XAU** under **Minor text format** to display both prices.
7. Configure the dashboard’s futures symbol, spot source, expiry, and analysis settings.
**Level Calculation**
**XAU Level = GC Level − Fixed Basis**
For example, with a GC starting price of **4100**, main spacing of **25**, and Fixed Basis of **26.50**:
- Main GC levels: **4100, 4125, 4150…**
- Main XAU levels: **4073.50, 4098.50, 4123.50…**
- With 10 subdivisions, minor levels are spaced **2.50** apart.
- A minor GC level of **4102.50** appears at **XAU 4076.00**.
**Fixed Levels and Dashboard Basis**
The main and minor lines use your manually entered **Fixed Basis**. Their price positions remain unchanged as the market moves. They change only when you adjust the starting GC price, main spacing, subdivision count, or Fixed Basis.
The dashboard separately calculates **Market Basis = Futures − Spot** from the available price feeds. Changes in market basis do not move the plotted levels.
**How to Read the Dashboard**
- **Basis ($ / %):** The futures premium or discount relative to spot.
- **Annualized:** Basis percentage converted into an annual rate using days to expiry.
- **Carry vs Rate:** Annualized basis minus the reference interest rate.
- **Fair Basis / Rich–Cheap:** An interest-only pricing estimate and the market basis’s difference from it.
- **Z-score / Percentile:** The current basis’s position relative to recent historical observations. Lookback is measured in chart bars; percentile is not the probability of a price move.
- **Status:** Classifies basis conditions as normal contango, elevated, compressed, or backwardation.
Use the plotted levels as reference points for observing price reactions and organizing chart analysis. They are calculated levels, not automatically detected support, resistance, or CME options positioning.
Automatic expiry is a calendar estimate. For contract-specific analysis, select the actual futures contract and enter its expiry manually. Data may be delayed, and annualized values are not guaranteed returns. The indicator does not generate standalone buy or sell signals.
This indicator maps GC gold futures price levels onto an XAUUSD chart using a manually defined, fixed basis. It combines 12 main levels, optional dashed subdivisions, and a dashboard for monitoring the futures–spot price difference.
**Main Features**
- **12 main levels:** Automatically generated from a GC starting price and a spacing value.
- **Dashed minor levels:** Divide each main interval into equal parts. The default setting of 10 parts creates 9 minor lines between adjacent main levels.
- **Price labels:** Main levels display GC and XAU prices. Minor labels can display XAU, GC, or both.
- **Display controls:** Show or hide individual main levels, toggle minor lines and their labels, and adjust colors, line widths, transparency, text size, and text position.
- **Basis dashboard:** Displays futures and spot prices, market basis, annualized basis, an interest-based fair basis estimate, Z-score, percentile, and basis status.
**How to Set Up**
1. Add the indicator to a standard XAUUSD candlestick chart.
2. Enter **GC starting price (Level 1)** for the lowest main level.
3. Set **GC spacing** to define the distance between main levels.
4. Enter **Fixed Basis for 12 Levels (GC − XAU)**.
5. Under **Minor Levels**, enable dashed levels and choose **Parts per main interval**.
6. Select **GC | XAU** under **Minor text format** to display both prices.
7. Configure the dashboard’s futures symbol, spot source, expiry, and analysis settings.
**Level Calculation**
**XAU Level = GC Level − Fixed Basis**
For example, with a GC starting price of **4100**, main spacing of **25**, and Fixed Basis of **26.50**:
- Main GC levels: **4100, 4125, 4150…**
- Main XAU levels: **4073.50, 4098.50, 4123.50…**
- With 10 subdivisions, minor levels are spaced **2.50** apart.
- A minor GC level of **4102.50** appears at **XAU 4076.00**.
**Fixed Levels and Dashboard Basis**
The main and minor lines use your manually entered **Fixed Basis**. Their price positions remain unchanged as the market moves. They change only when you adjust the starting GC price, main spacing, subdivision count, or Fixed Basis.
The dashboard separately calculates **Market Basis = Futures − Spot** from the available price feeds. Changes in market basis do not move the plotted levels.
**How to Read the Dashboard**
- **Basis ($ / %):** The futures premium or discount relative to spot.
- **Annualized:** Basis percentage converted into an annual rate using days to expiry.
- **Carry vs Rate:** Annualized basis minus the reference interest rate.
- **Fair Basis / Rich–Cheap:** An interest-only pricing estimate and the market basis’s difference from it.
- **Z-score / Percentile:** The current basis’s position relative to recent historical observations. Lookback is measured in chart bars; percentile is not the probability of a price move.
- **Status:** Classifies basis conditions as normal contango, elevated, compressed, or backwardation.
Use the plotted levels as reference points for observing price reactions and organizing chart analysis. They are calculated levels, not automatically detected support, resistance, or CME options positioning.
Automatic expiry is a calendar estimate. For contract-specific analysis, select the actual futures contract and enter its expiry manually. Data may be delayed, and annualized values are not guaranteed returns. The indicator does not generate standalone buy or sell signals.

면책사항
해당 정보와 게시물은 금융, 투자, 트레이딩 또는 기타 유형의 조언이나 권장 사항으로 간주되지 않으며, 트레이딩뷰에서 제공하거나 보증하는 것이 아닙니다. 자세한 내용은 이용 약관을 참조하세요.
면책사항
해당 정보와 게시물은 금융, 투자, 트레이딩 또는 기타 유형의 조언이나 권장 사항으로 간주되지 않으며, 트레이딩뷰에서 제공하거나 보증하는 것이 아닙니다. 자세한 내용은 이용 약관을 참조하세요.