OPEN-SOURCE SCRIPT
Risk & Position Sizing Calculator
LEGAL DISCLAIMER — READ FIRST
**This script and this description are for EDUCATIONAL PURPOSES ONLY.**
- This is **not** investment advice, a trading recommendation, or a solicitation to buy or sell any stock, index, or F&O (Futures & Options) contract.
- Nothing in this script or description constitutes a recommendation to trade Nifty, Bank Nifty, or any stock, in cash, futures, or options.
- The script does **not** predict market direction and does **not** guarantee profit. Past performance of any rule-set (including the EMA-crossover logic used here) does not guarantee future results.
- Trading in equities, futures, and options carries a **high risk of loss**, including the possible loss of your entire invested capital, and is not suitable for everyone.
- All entries, exits, position sizes, and trading decisions remain **solely your own responsibility**.
- Please independently verify all information and **consult a SEBI-registered Investment Adviser** before making any trading or investment decision.
- The creator of this script accepts **no liability** for any financial loss arising from its use.
By using this script, you acknowledge that you understand and accept the above.
---
1. What This Script Is
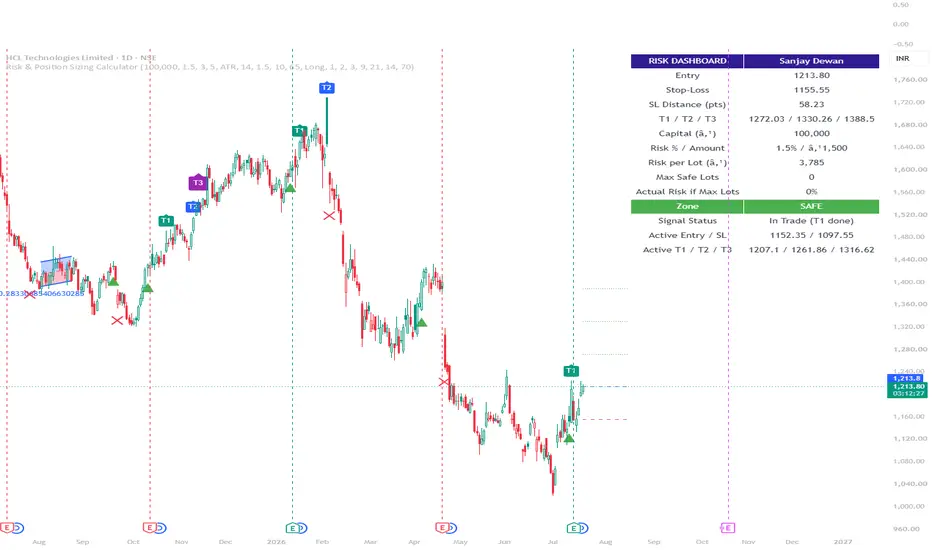
A **risk and position-sizing calculator** for TradingView, with an **optional mechanical signal add-on**. It does two separate jobs:
1. **Risk Calculator (always on):** tells you how many lots you could safely trade on any chart (Nifty, Bank Nifty, or a stock), given your capital and risk tolerance — the math, not a prediction.
2. **Signal Add-on (optional, toggle on/off):** plots a Buy marker based on one fixed technical rule (EMA crossover, optionally RSI-filtered), then tracks that trade and marks profit-booking levels (T1/T2/T3) and stop-loss on the chart, with alerts.
3 hours ago
Release Notes
ns on top of any chart (Nifty, Bank Nifty, or a stock) and answers: "If I enter here, how many lots can I safely trade given my capital and risk tolerance?"
1. Inputs (4 setting groups)
Capital & Risk — your capital, risk % per trade, and Caution/High-Risk thresholds that color-code the dashboard.
Stop-Loss Method — ATR-based (volatility-derived) or Swing High/Low (distance to recent swing point).
Contract Details — lot size (65 for Nifty by default, editable) and direction (Long/Short).
Targets — T1/T2/T3 as multiples of your risk (1R, 2R, 3R), mirroring the T1/T2/T3 in your original screenshot.
2. Calculations
Uses current close as "entry."
Computes stop-loss distance via ta.atr() × multiplier, or highest/lowest price over your lookback.
Derives stop-loss price and the three target prices as R-multiples from entry.
Computes risk amount (capital × risk%), risk per lot (SL distance × lot size), and max safe lots (risk amount ÷ risk per lot) — the same math behind "Safe Lots" in your dashboard tool.
Flags a zone: SAFE / CAUTION / HIGH RISK based on your risk % vs. the thresholds.
3. Visuals
Dashed/dotted lines on the chart for entry, stop-loss, and the three targets.
A dashboard table (top-right corner) showing all the numbers, updated on the latest bar.
What it doesn't do: pull option-chain data (strike, premium, decay) — not accessible
**This script and this description are for EDUCATIONAL PURPOSES ONLY.**
- This is **not** investment advice, a trading recommendation, or a solicitation to buy or sell any stock, index, or F&O (Futures & Options) contract.
- Nothing in this script or description constitutes a recommendation to trade Nifty, Bank Nifty, or any stock, in cash, futures, or options.
- The script does **not** predict market direction and does **not** guarantee profit. Past performance of any rule-set (including the EMA-crossover logic used here) does not guarantee future results.
- Trading in equities, futures, and options carries a **high risk of loss**, including the possible loss of your entire invested capital, and is not suitable for everyone.
- All entries, exits, position sizes, and trading decisions remain **solely your own responsibility**.
- Please independently verify all information and **consult a SEBI-registered Investment Adviser** before making any trading or investment decision.
- The creator of this script accepts **no liability** for any financial loss arising from its use.
By using this script, you acknowledge that you understand and accept the above.
---
1. What This Script Is
A **risk and position-sizing calculator** for TradingView, with an **optional mechanical signal add-on**. It does two separate jobs:
1. **Risk Calculator (always on):** tells you how many lots you could safely trade on any chart (Nifty, Bank Nifty, or a stock), given your capital and risk tolerance — the math, not a prediction.
2. **Signal Add-on (optional, toggle on/off):** plots a Buy marker based on one fixed technical rule (EMA crossover, optionally RSI-filtered), then tracks that trade and marks profit-booking levels (T1/T2/T3) and stop-loss on the chart, with alerts.
3 hours ago
Release Notes
ns on top of any chart (Nifty, Bank Nifty, or a stock) and answers: "If I enter here, how many lots can I safely trade given my capital and risk tolerance?"
1. Inputs (4 setting groups)
Capital & Risk — your capital, risk % per trade, and Caution/High-Risk thresholds that color-code the dashboard.
Stop-Loss Method — ATR-based (volatility-derived) or Swing High/Low (distance to recent swing point).
Contract Details — lot size (65 for Nifty by default, editable) and direction (Long/Short).
Targets — T1/T2/T3 as multiples of your risk (1R, 2R, 3R), mirroring the T1/T2/T3 in your original screenshot.
2. Calculations
Uses current close as "entry."
Computes stop-loss distance via ta.atr() × multiplier, or highest/lowest price over your lookback.
Derives stop-loss price and the three target prices as R-multiples from entry.
Computes risk amount (capital × risk%), risk per lot (SL distance × lot size), and max safe lots (risk amount ÷ risk per lot) — the same math behind "Safe Lots" in your dashboard tool.
Flags a zone: SAFE / CAUTION / HIGH RISK based on your risk % vs. the thresholds.
3. Visuals
Dashed/dotted lines on the chart for entry, stop-loss, and the three targets.
A dashboard table (top-right corner) showing all the numbers, updated on the latest bar.
What it doesn't do: pull option-chain data (strike, premium, decay) — not accessible
오픈 소스 스크립트
트레이딩뷰의 진정한 정신에 따라, 이 스크립트의 작성자는 이를 오픈소스로 공개하여 트레이더들이 기능을 검토하고 검증할 수 있도록 했습니다. 작성자에게 찬사를 보냅니다! 이 코드는 무료로 사용할 수 있지만, 코드를 재게시하는 경우 하우스 룰이 적용된다는 점을 기억하세요.

An advanced technical indicator built for the TradingView platform, intended for educational and informational purposes only. It does not constitute financial advice or a recommendation to buy or sell any security
면책사항
해당 정보와 게시물은 금융, 투자, 트레이딩 또는 기타 유형의 조언이나 권장 사항으로 간주되지 않으며, 트레이딩뷰에서 제공하거나 보증하는 것이 아닙니다. 자세한 내용은 이용 약관을 참조하세요.
오픈 소스 스크립트
트레이딩뷰의 진정한 정신에 따라, 이 스크립트의 작성자는 이를 오픈소스로 공개하여 트레이더들이 기능을 검토하고 검증할 수 있도록 했습니다. 작성자에게 찬사를 보냅니다! 이 코드는 무료로 사용할 수 있지만, 코드를 재게시하는 경우 하우스 룰이 적용된다는 점을 기억하세요.
An advanced technical indicator built for the TradingView platform, intended for educational and informational purposes only. It does not constitute financial advice or a recommendation to buy or sell any security
면책사항
해당 정보와 게시물은 금융, 투자, 트레이딩 또는 기타 유형의 조언이나 권장 사항으로 간주되지 않으며, 트레이딩뷰에서 제공하거나 보증하는 것이 아닙니다. 자세한 내용은 이용 약관을 참조하세요.