OPEN-SOURCE SCRIPT
Divergence Nexus [forexobroker]
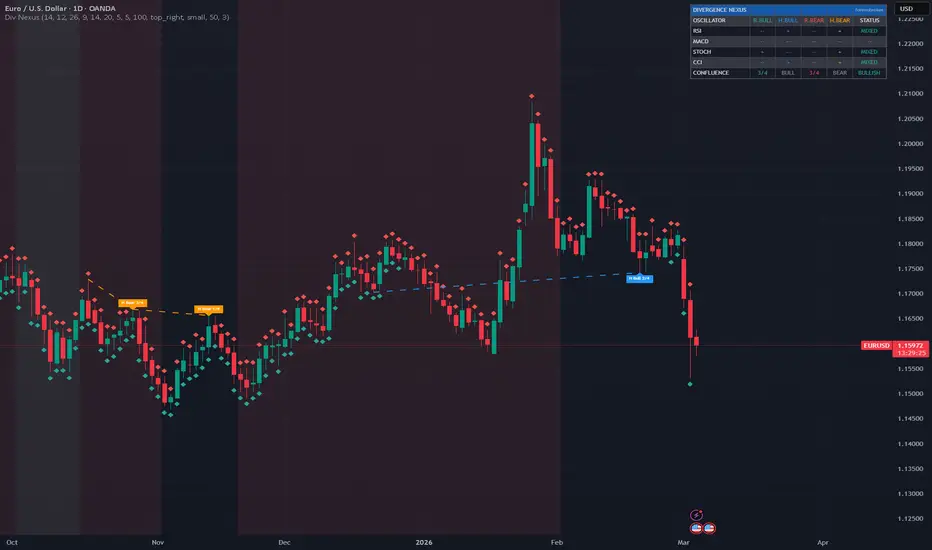
Divergence Nexus unifies divergence detection across four oscillators into a single indicator. Instead of checking RSI, MACD, Stochastic, and CCI on separate panels, this script scans all four simultaneously and rates signal strength through a confluence score — how many oscillators agree on the divergence.
WHAT IT DOES
The indicator monitors four oscillators for both regular divergences (potential reversals) and hidden divergences (trend continuation signals). When price makes a new swing high or low that disagrees with the oscillator's swing, a divergence is flagged. Lines are drawn directly on the price chart at the divergence points, and a label shows the type and confluence count.
A compact dashboard displays which oscillators have recently detected divergences, their direction, and the overall confluence score. When 3 or 4 oscillators agree, the bar background highlights to draw attention to high-probability setups.
HOW IT WORKS
Four oscillators are calculated: RSI, MACD histogram, Stochastic %K, and CCI
Pivot highs and lows are detected on both the price chart and each oscillator using the same lookback period
When both a price pivot and an oscillator pivot confirm on the same bar, the pivot pair is stored
Each oscillator's two most recent pivots are compared to detect divergences:
Regular Bullish: price makes a lower low, oscillator makes a higher low (reversal up)
Regular Bearish: price makes a higher high, oscillator makes a lower high (reversal down)
Hidden Bullish: price makes a higher low, oscillator makes a lower low (uptrend continuation)
Hidden Bearish: price makes a lower high, oscillator makes a higher high (downtrend continuation)
Confluence is counted: how many oscillators detected the same direction on the same bar
Lines, labels, and dashboard update with the results
THE 4 OSCILLATORS
Each oscillator captures a different aspect of momentum:
RSI (Relative Strength Index) — Measures overbought/oversold conditions through price momentum. Default period: 14
MACD Histogram — Shows the distance between MACD line and signal line, capturing momentum acceleration. Default: 12/26/9
Stochastic %K — Compares closing price to the price range over a period, sensitive to price turns. Default period: 14
CCI (Commodity Channel Index) — Measures price deviation from its statistical mean, identifying cyclical turns. Default period: 20
CONFLUENCE SCORING
The core differentiator. When a divergence is detected, the script counts how many oscillators found the same direction:
1/4 — Weak signal: only one oscillator diverging. Use with caution
2/4 — Moderate signal: two oscillators agree. Worth monitoring
3/4 — Strong signal: three oscillators confirm. High-probability setup
4/4 — Very strong signal: all four oscillators diverging together. Rare and powerful
DIVERGENCE TYPES
Regular divergences signal potential trend reversals:
Regular Bullish (teal line, solid): Price lower low + oscillator higher low. Suggests the downtrend may reverse upward
Regular Bearish (red line, solid): Price higher high + oscillator lower high. Suggests the uptrend may reverse downward
Hidden divergences signal trend continuation:
Hidden Bullish (blue line, dashed): Price higher low + oscillator lower low. Suggests the uptrend will continue
Hidden Bearish (orange line, dashed): Price lower high + oscillator higher high. Suggests the downtrend will continue
NEXUS DASHBOARD
A compact panel showing:
Per-oscillator status: which divergence types each oscillator has recently detected
Direction columns: R.BULL, H.BULL, R.BEAR, H.BEAR with "+" for active or "--" for none
Status per oscillator: BULL, BEAR, MIXED, or -- based on recent activity
Confluence row: total bullish and bearish agreement counts out of 4
Signal: BULLISH or BEARISH when confluence meets the alert threshold
FEATURES
4 oscillators scanned simultaneously (RSI, MACD histogram, Stochastic %K, CCI)
8 divergence types detected (regular + hidden for each direction)
Confluence scoring from 1/4 to 4/4
Non-repainting: all divergences confirmed by pivot lookback on closed bars
Divergence lines drawn on price chart (solid for regular, dashed for hidden)
Labels showing divergence type and confluence count
Bar background highlight on high-confluence signals
Nexus Dashboard with per-oscillator breakdown
Toggle individual oscillators on/off
Toggle regular and hidden divergence detection independently
6 alert conditions (bullish, bearish, high-confluence bullish/bearish, any, any high-confluence)
Data Window integration showing all oscillator values and confluence counts
Configurable pivot lookback, min/max bar distance, drawing limits
Theme-aware dashboard adapts to light and dark chart themes
Works on any instrument and any timeframe
Zero security calls — runs entirely on current chart data
HOW TO READ THE SIGNALS
Teal solid line below price = Regular bullish divergence (potential reversal up)
Red solid line above price = Regular bearish divergence (potential reversal down)
Blue dashed line below price = Hidden bullish divergence (uptrend continuation)
Orange dashed line above price = Hidden bearish divergence (downtrend continuation)
Diamond below bar = Bullish divergence detected this bar
Diamond above bar = Bearish divergence detected this bar
Tinted background = High-confluence signal (3/4 or 4/4 oscillators agree)
Dashboard "+" = That oscillator has a recent divergence of that type
USE CASES
Reversal Trading — Wait for a 3/4 or 4/4 regular divergence at a key support/resistance level. The more oscillators that agree, the higher the probability of reversal
Trend Continuation — Hidden divergences with 2/4+ confluence confirm pullbacks within established trends are buying/selling opportunities
Exit Signals — When holding a long position and a 3/4+ bearish divergence appears, consider tightening stops or taking partial profits
Confluence Filter — Use the divergence score as a filter for other trading systems. Only take entries when Divergence Nexus shows 2/4+ agreement
Multi-Oscillator Analysis — Instead of adding RSI, MACD, Stochastic, and CCI as separate indicators, get all four divergence signals in one clean overlay
Timeframe Selection — Use higher timeframes (4H, Daily) for strong directional divergences, lower timeframes (15m, 1H) for precise entry timing
SETTINGS
Oscillators: Adjust individual oscillator periods or disable specific oscillators. Default settings match standard industry values.
Detection: Set pivot lookback depth (higher = fewer but stronger pivots), minimum and maximum bar distance between pivots, and toggle regular/hidden detection.
Display: Toggle lines, labels, dashboard, and background highlighting. Position the dashboard anywhere on the chart. Control maximum number of drawings kept on chart.
Colors: Customize colors for each divergence type (regular bullish/bearish, hidden bullish/bearish).
Alerts: Set the minimum confluence level required for high-confluence alerts.
TECHNICAL NOTES
Zero security calls — works entirely on the current chart's data
Non-repainting — all pivots use equal left/right bars with barstate.isconfirmed processing
Divergences are confirmed only after the pivot lookback period has passed
Maximum 200 lines and 100 labels (configurable cleanup threshold)
10 pivot detection calls (2 price + 2 per oscillator) computed efficiently at global scope
Dashboard updates only on the last bar for performance
Works on any instrument and any timeframe
DISCLAIMER
This indicator is for educational and informational purposes only. It does not constitute financial advice. Divergence signals should be used as one component of a complete trading methodology that includes proper risk management. Past performance does not guarantee future results. Always use stop losses and trade within your risk tolerance.
WHAT IT DOES
The indicator monitors four oscillators for both regular divergences (potential reversals) and hidden divergences (trend continuation signals). When price makes a new swing high or low that disagrees with the oscillator's swing, a divergence is flagged. Lines are drawn directly on the price chart at the divergence points, and a label shows the type and confluence count.
A compact dashboard displays which oscillators have recently detected divergences, their direction, and the overall confluence score. When 3 or 4 oscillators agree, the bar background highlights to draw attention to high-probability setups.
HOW IT WORKS
Four oscillators are calculated: RSI, MACD histogram, Stochastic %K, and CCI
Pivot highs and lows are detected on both the price chart and each oscillator using the same lookback period
When both a price pivot and an oscillator pivot confirm on the same bar, the pivot pair is stored
Each oscillator's two most recent pivots are compared to detect divergences:
Regular Bullish: price makes a lower low, oscillator makes a higher low (reversal up)
Regular Bearish: price makes a higher high, oscillator makes a lower high (reversal down)
Hidden Bullish: price makes a higher low, oscillator makes a lower low (uptrend continuation)
Hidden Bearish: price makes a lower high, oscillator makes a higher high (downtrend continuation)
Confluence is counted: how many oscillators detected the same direction on the same bar
Lines, labels, and dashboard update with the results
THE 4 OSCILLATORS
Each oscillator captures a different aspect of momentum:
RSI (Relative Strength Index) — Measures overbought/oversold conditions through price momentum. Default period: 14
MACD Histogram — Shows the distance between MACD line and signal line, capturing momentum acceleration. Default: 12/26/9
Stochastic %K — Compares closing price to the price range over a period, sensitive to price turns. Default period: 14
CCI (Commodity Channel Index) — Measures price deviation from its statistical mean, identifying cyclical turns. Default period: 20
CONFLUENCE SCORING
The core differentiator. When a divergence is detected, the script counts how many oscillators found the same direction:
1/4 — Weak signal: only one oscillator diverging. Use with caution
2/4 — Moderate signal: two oscillators agree. Worth monitoring
3/4 — Strong signal: three oscillators confirm. High-probability setup
4/4 — Very strong signal: all four oscillators diverging together. Rare and powerful
DIVERGENCE TYPES
Regular divergences signal potential trend reversals:
Regular Bullish (teal line, solid): Price lower low + oscillator higher low. Suggests the downtrend may reverse upward
Regular Bearish (red line, solid): Price higher high + oscillator lower high. Suggests the uptrend may reverse downward
Hidden divergences signal trend continuation:
Hidden Bullish (blue line, dashed): Price higher low + oscillator lower low. Suggests the uptrend will continue
Hidden Bearish (orange line, dashed): Price lower high + oscillator higher high. Suggests the downtrend will continue
NEXUS DASHBOARD
A compact panel showing:
Per-oscillator status: which divergence types each oscillator has recently detected
Direction columns: R.BULL, H.BULL, R.BEAR, H.BEAR with "+" for active or "--" for none
Status per oscillator: BULL, BEAR, MIXED, or -- based on recent activity
Confluence row: total bullish and bearish agreement counts out of 4
Signal: BULLISH or BEARISH when confluence meets the alert threshold
FEATURES
4 oscillators scanned simultaneously (RSI, MACD histogram, Stochastic %K, CCI)
8 divergence types detected (regular + hidden for each direction)
Confluence scoring from 1/4 to 4/4
Non-repainting: all divergences confirmed by pivot lookback on closed bars
Divergence lines drawn on price chart (solid for regular, dashed for hidden)
Labels showing divergence type and confluence count
Bar background highlight on high-confluence signals
Nexus Dashboard with per-oscillator breakdown
Toggle individual oscillators on/off
Toggle regular and hidden divergence detection independently
6 alert conditions (bullish, bearish, high-confluence bullish/bearish, any, any high-confluence)
Data Window integration showing all oscillator values and confluence counts
Configurable pivot lookback, min/max bar distance, drawing limits
Theme-aware dashboard adapts to light and dark chart themes
Works on any instrument and any timeframe
Zero security calls — runs entirely on current chart data
HOW TO READ THE SIGNALS
Teal solid line below price = Regular bullish divergence (potential reversal up)
Red solid line above price = Regular bearish divergence (potential reversal down)
Blue dashed line below price = Hidden bullish divergence (uptrend continuation)
Orange dashed line above price = Hidden bearish divergence (downtrend continuation)
Diamond below bar = Bullish divergence detected this bar
Diamond above bar = Bearish divergence detected this bar
Tinted background = High-confluence signal (3/4 or 4/4 oscillators agree)
Dashboard "+" = That oscillator has a recent divergence of that type
USE CASES
Reversal Trading — Wait for a 3/4 or 4/4 regular divergence at a key support/resistance level. The more oscillators that agree, the higher the probability of reversal
Trend Continuation — Hidden divergences with 2/4+ confluence confirm pullbacks within established trends are buying/selling opportunities
Exit Signals — When holding a long position and a 3/4+ bearish divergence appears, consider tightening stops or taking partial profits
Confluence Filter — Use the divergence score as a filter for other trading systems. Only take entries when Divergence Nexus shows 2/4+ agreement
Multi-Oscillator Analysis — Instead of adding RSI, MACD, Stochastic, and CCI as separate indicators, get all four divergence signals in one clean overlay
Timeframe Selection — Use higher timeframes (4H, Daily) for strong directional divergences, lower timeframes (15m, 1H) for precise entry timing
SETTINGS
Oscillators: Adjust individual oscillator periods or disable specific oscillators. Default settings match standard industry values.
Detection: Set pivot lookback depth (higher = fewer but stronger pivots), minimum and maximum bar distance between pivots, and toggle regular/hidden detection.
Display: Toggle lines, labels, dashboard, and background highlighting. Position the dashboard anywhere on the chart. Control maximum number of drawings kept on chart.
Colors: Customize colors for each divergence type (regular bullish/bearish, hidden bullish/bearish).
Alerts: Set the minimum confluence level required for high-confluence alerts.
TECHNICAL NOTES
Zero security calls — works entirely on the current chart's data
Non-repainting — all pivots use equal left/right bars with barstate.isconfirmed processing
Divergences are confirmed only after the pivot lookback period has passed
Maximum 200 lines and 100 labels (configurable cleanup threshold)
10 pivot detection calls (2 price + 2 per oscillator) computed efficiently at global scope
Dashboard updates only on the last bar for performance
Works on any instrument and any timeframe
DISCLAIMER
This indicator is for educational and informational purposes only. It does not constitute financial advice. Divergence signals should be used as one component of a complete trading methodology that includes proper risk management. Past performance does not guarantee future results. Always use stop losses and trade within your risk tolerance.
오픈 소스 스크립트
트레이딩뷰의 진정한 정신에 따라, 이 스크립트의 작성자는 이를 오픈소스로 공개하여 트레이더들이 기능을 검토하고 검증할 수 있도록 했습니다. 작성자에게 찬사를 보냅니다! 이 코드는 무료로 사용할 수 있지만, 코드를 재게시하는 경우 하우스 룰이 적용된다는 점을 기억하세요.

🔵Gain access to our powerful tools : kestutisbalciunas.com/tradingview/
🔵Join our free telegram for updates : t.me/algotradingedge
All scripts & content provided by Forexobroker are for informational & educational purposes only.
🔵Join our free telegram for updates : t.me/algotradingedge
All scripts & content provided by Forexobroker are for informational & educational purposes only.
면책사항
해당 정보와 게시물은 금융, 투자, 트레이딩 또는 기타 유형의 조언이나 권장 사항으로 간주되지 않으며, 트레이딩뷰에서 제공하거나 보증하는 것이 아닙니다. 자세한 내용은 이용 약관을 참조하세요.
오픈 소스 스크립트
트레이딩뷰의 진정한 정신에 따라, 이 스크립트의 작성자는 이를 오픈소스로 공개하여 트레이더들이 기능을 검토하고 검증할 수 있도록 했습니다. 작성자에게 찬사를 보냅니다! 이 코드는 무료로 사용할 수 있지만, 코드를 재게시하는 경우 하우스 룰이 적용된다는 점을 기억하세요.
🔵Gain access to our powerful tools : kestutisbalciunas.com/tradingview/
🔵Join our free telegram for updates : t.me/algotradingedge
All scripts & content provided by Forexobroker are for informational & educational purposes only.
🔵Join our free telegram for updates : t.me/algotradingedge
All scripts & content provided by Forexobroker are for informational & educational purposes only.
면책사항
해당 정보와 게시물은 금융, 투자, 트레이딩 또는 기타 유형의 조언이나 권장 사항으로 간주되지 않으며, 트레이딩뷰에서 제공하거나 보증하는 것이 아닙니다. 자세한 내용은 이용 약관을 참조하세요.