OPEN-SOURCE SCRIPT
CandelaCharts - MTF FVG Alignment
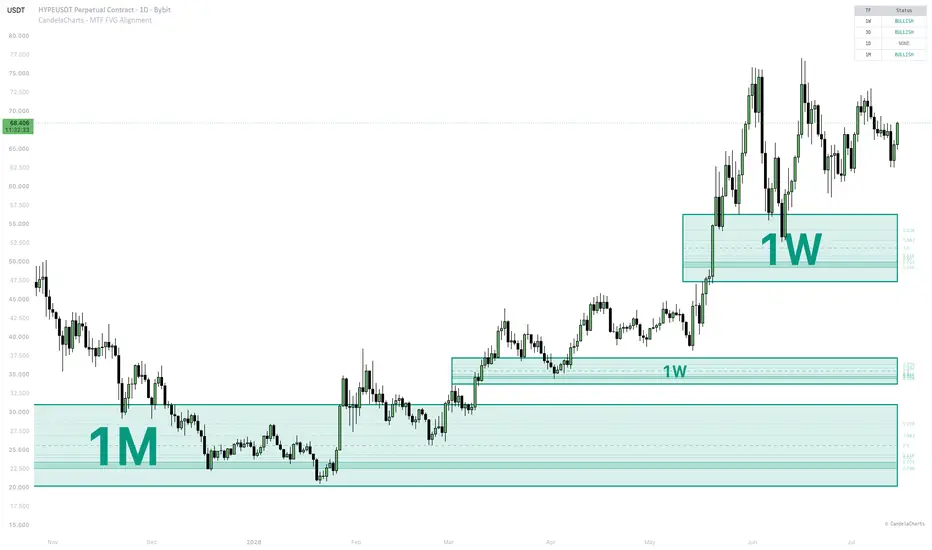
📝 Overview
The CandelaCharts - MTF FVG Alignment indicator detects Fair Value Gaps (FVGs) across up to four customizable timeframes and visualises them directly on the chart. A Fair Value Gap is a three-candle pattern where price moved so rapidly that an unfilled area remains between the high of the first candle and the low of the third candle, representing a price imbalance the market often returns to fill.
The core strength of this indicator is Confluence. An alignment signal is generated only when every enabled timeframe shows FVGs in the same direction (all Bullish or all Bearish), giving traders a powerful multi-timeframe confirmation before taking a position.
📦 Features
⚙️ Settings
⚡️ Showcase
Multi-Timeframe FVG Boxes

Fibonacci Levels & Golden Pocket

Status Dashboard

🔎 Usage
⚠️ Disclaimer
Trading involves significant risk, and many participants may incur losses. The content on this site is not intended as financial advice and should not be interpreted as such. Decisions to buy, sell, hold, or trade securities, commodities, or other financial instruments carry inherent risks and are best made with guidance from qualified financial professionals. Past performance is not indicative of future results.
The CandelaCharts - MTF FVG Alignment indicator detects Fair Value Gaps (FVGs) across up to four customizable timeframes and visualises them directly on the chart. A Fair Value Gap is a three-candle pattern where price moved so rapidly that an unfilled area remains between the high of the first candle and the low of the third candle, representing a price imbalance the market often returns to fill.
The core strength of this indicator is Confluence. An alignment signal is generated only when every enabled timeframe shows FVGs in the same direction (all Bullish or all Bearish), giving traders a powerful multi-timeframe confirmation before taking a position.
📦 Features
- Four-Timeframe Analysis: Track up to four independent timeframes simultaneously with per-TF toggle and FVG count.
- Confluence Alignment: Automatic detection of Bullish or Bearish alignment across all enabled timeframes.
- Bias Filter: Filter displayed FVGs to show only Bullish, only Bearish, or both (Neutral).
- FVG Mitigation: FVGs are automatically invalidated and removed from the chart once they are fully filled by price action.
- Hide Overlapped: Clean up chart clutter by automatically hiding lower-timeframe or older FVGs that overlap with others.
- Fibonacci Levels: Optional Fibonacci retracement levels (0.236, 0.382, 0.5, 0.618, 0.65, 0.705, 0.786) drawn inside each FVG with a highlighted Golden Pocket zone (0.705–0.786).
- FVG Visuals: Semi-transparent boxes showing active FVGs for each timeframe, with configurable borders and midlines.
- Status Dashboard: A clean table showing the current directional status (Bullish / Bearish / None) for each enabled timeframe.
⚙️ Settings
- Timeframes
- TF 1–4: Each timeframe row has a toggle (show/hide), a timeframe selector, and an FVG count (1–10) controlling how many recent FVGs are displayed for that timeframe. Defaults are 1D, 4H, 1H, and 15m.
- Settings
- Bias Filter: Filter displayed FVGs by direction — Neutral (show all), Bullish (show only bullish FVGs), or Bearish (show only bearish FVGs).
- Bull / Bear Colors: Customise the colours used for bullish and bearish FVG zones.
- Border: Toggle the FVG box border and configure its style (Solid, Dotted, Dashed) and width (1–5).
- Midline: Toggle the Consequent Encroachment midline inside each FVG and configure its style and width. When enabled, the timeframe label moves outside the box.
- Fibonacci: Toggle the drawing of Fibonacci retracement levels inside each FVG, including the highlighted Golden Pocket (0.705–0.786).
- Hide Overlapped: Toggle whether to hide overlapping FVGs across different timeframes to keep the chart clean (prioritising higher timeframes).
- Dashboard
- Show: Toggle the multi-timeframe status dashboard.
- Position: Choose the dashboard corner — Top Right, Top Left, Bottom Right, or Bottom Left.
⚡️ Showcase
Multi-Timeframe FVG Boxes
Fibonacci Levels & Golden Pocket
Status Dashboard
🔎 Usage
- Trend Identification: Glance at the dashboard to see the current bias of each higher timeframe at a glance.
- Confluence: When all enabled timeframes align in the same direction, it provides strong multi-timeframe confluence for a directional trade.
- Fibonacci Entries: Use the Fibonacci levels inside each FVG — particularly the Golden Pocket (0.705–0.786) — for precise entries when price retraces into the gap.
- Bias Filtering: Set the Bias Filter to Bullish or Bearish to remove counter-trend FVGs and keep the chart focused on your directional thesis.
- Execution: Use the alignment as confirmation for your existing strategy. Bullish alignment suggests upward momentum; Bearish alignment suggests downward momentum.
⚠️ Disclaimer
Trading involves significant risk, and many participants may incur losses. The content on this site is not intended as financial advice and should not be interpreted as such. Decisions to buy, sell, hold, or trade securities, commodities, or other financial instruments carry inherent risks and are best made with guidance from qualified financial professionals. Past performance is not indicative of future results.
오픈 소스 스크립트
트레이딩뷰의 진정한 정신에 따라, 이 스크립트의 작성자는 이를 오픈소스로 공개하여 트레이더들이 기능을 검토하고 검증할 수 있도록 했습니다. 작성자에게 찬사를 보냅니다! 이 코드는 무료로 사용할 수 있지만, 코드를 재게시하는 경우 하우스 룰이 적용된다는 점을 기억하세요.

🔵 Tools that give you the edge: candelacharts.com/.
🔵 Join our free discord for updates: candelacharts.com/community
🔵 Join our free discord for updates: candelacharts.com/community
면책사항
해당 정보와 게시물은 금융, 투자, 트레이딩 또는 기타 유형의 조언이나 권장 사항으로 간주되지 않으며, 트레이딩뷰에서 제공하거나 보증하는 것이 아닙니다. 자세한 내용은 이용 약관을 참조하세요.
오픈 소스 스크립트
트레이딩뷰의 진정한 정신에 따라, 이 스크립트의 작성자는 이를 오픈소스로 공개하여 트레이더들이 기능을 검토하고 검증할 수 있도록 했습니다. 작성자에게 찬사를 보냅니다! 이 코드는 무료로 사용할 수 있지만, 코드를 재게시하는 경우 하우스 룰이 적용된다는 점을 기억하세요.
🔵 Tools that give you the edge: candelacharts.com/.
🔵 Join our free discord for updates: candelacharts.com/community
🔵 Join our free discord for updates: candelacharts.com/community
면책사항
해당 정보와 게시물은 금융, 투자, 트레이딩 또는 기타 유형의 조언이나 권장 사항으로 간주되지 않으며, 트레이딩뷰에서 제공하거나 보증하는 것이 아닙니다. 자세한 내용은 이용 약관을 참조하세요.