OPEN-SOURCE SCRIPT
Blue Sky (All-Time High) HUD
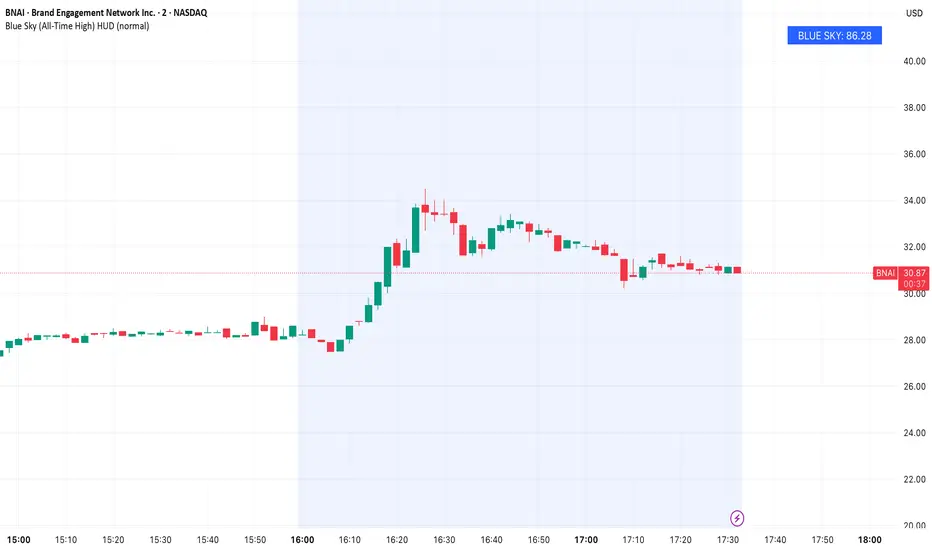
Blue Sky at a Glance
Blue Sky (All-Time High) HUD is a fixed, price-overlay indicator designed to instantly show a stock’s highest price achieved within the loaded chart history, without requiring you to zoom out or scan manually.
Instead of drawing cluttered historical markers, this script calculates the running all-time high and displays it in a clean, fixed HUD anchored to the top-right of the chart.
How It Works
The script continuously tracks the highest high reached on the chart and updates in real time as new highs are made.
The current Blue Sky value is:
Highest high observed within the loaded chart history
The value is displayed in two ways:
• A fixed HUD panel for quick visual reference
• The indicator status line for fast numerical reading
An optional horizontal line can be enabled to visualize the exact level on the chart.
How to Use It
This indicator is informational, not predictive.
Common use cases:
• Instantly see how far price is from its all-time high
• Evaluate overhead supply vs open air
• Contextualize breakouts relative to historical extremes
• Assess long-term expansion potential
Examples:
• Price approaching Blue Sky may indicate major breakout tests
• Price far below Blue Sky may signal long-term recovery room
• New highs automatically update the level in real time
Customization
You can adjust:
• Font size of the HUD display
• Optional visibility of the all-time high line
Design Philosophy
• Fixed, non-moving HUD
• No separate pane
• No repainting
• Lightweight and unobtrusive
• Built for instant context at a glance
This tool is designed for traders who want immediate awareness of a stock’s historical ceiling without disrupting price structure.
Blue Sky (All-Time High) HUD is a fixed, price-overlay indicator designed to instantly show a stock’s highest price achieved within the loaded chart history, without requiring you to zoom out or scan manually.
Instead of drawing cluttered historical markers, this script calculates the running all-time high and displays it in a clean, fixed HUD anchored to the top-right of the chart.
How It Works
The script continuously tracks the highest high reached on the chart and updates in real time as new highs are made.
The current Blue Sky value is:
Highest high observed within the loaded chart history
The value is displayed in two ways:
• A fixed HUD panel for quick visual reference
• The indicator status line for fast numerical reading
An optional horizontal line can be enabled to visualize the exact level on the chart.
How to Use It
This indicator is informational, not predictive.
Common use cases:
• Instantly see how far price is from its all-time high
• Evaluate overhead supply vs open air
• Contextualize breakouts relative to historical extremes
• Assess long-term expansion potential
Examples:
• Price approaching Blue Sky may indicate major breakout tests
• Price far below Blue Sky may signal long-term recovery room
• New highs automatically update the level in real time
Customization
You can adjust:
• Font size of the HUD display
• Optional visibility of the all-time high line
Design Philosophy
• Fixed, non-moving HUD
• No separate pane
• No repainting
• Lightweight and unobtrusive
• Built for instant context at a glance
This tool is designed for traders who want immediate awareness of a stock’s historical ceiling without disrupting price structure.
오픈 소스 스크립트
트레이딩뷰의 진정한 정신에 따라, 이 스크립트의 작성자는 이를 오픈소스로 공개하여 트레이더들이 기능을 검토하고 검증할 수 있도록 했습니다. 작성자에게 찬사를 보냅니다! 이 코드는 무료로 사용할 수 있지만, 코드를 재게시하는 경우 하우스 룰이 적용된다는 점을 기억하세요.

면책사항
해당 정보와 게시물은 금융, 투자, 트레이딩 또는 기타 유형의 조언이나 권장 사항으로 간주되지 않으며, 트레이딩뷰에서 제공하거나 보증하는 것이 아닙니다. 자세한 내용은 이용 약관을 참조하세요.
오픈 소스 스크립트
트레이딩뷰의 진정한 정신에 따라, 이 스크립트의 작성자는 이를 오픈소스로 공개하여 트레이더들이 기능을 검토하고 검증할 수 있도록 했습니다. 작성자에게 찬사를 보냅니다! 이 코드는 무료로 사용할 수 있지만, 코드를 재게시하는 경우 하우스 룰이 적용된다는 점을 기억하세요.
면책사항
해당 정보와 게시물은 금융, 투자, 트레이딩 또는 기타 유형의 조언이나 권장 사항으로 간주되지 않으며, 트레이딩뷰에서 제공하거나 보증하는 것이 아닙니다. 자세한 내용은 이용 약관을 참조하세요.