업데이트됨
day of Month | xilix
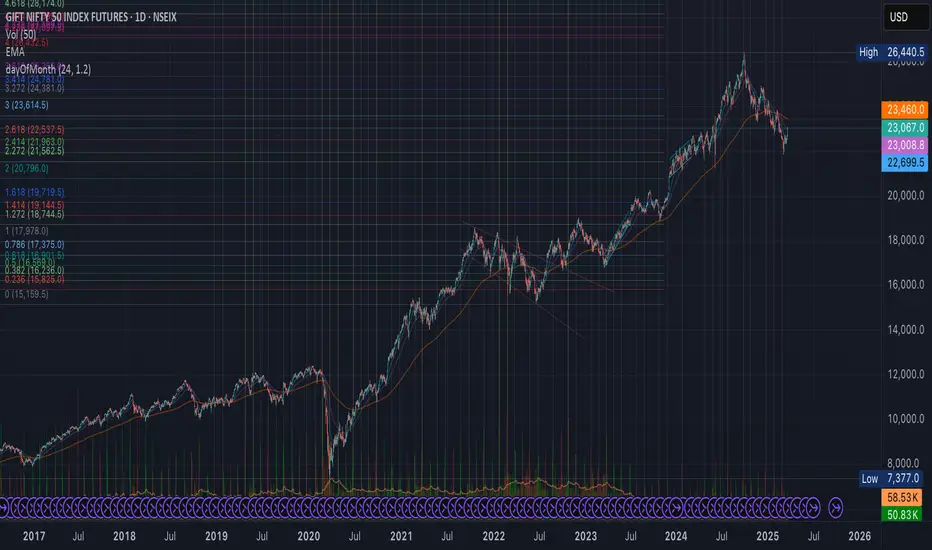
Monthly Marker (1D Only)
The Monthly Marker indicator automatically highlights a specific day of the month on a daily (1D) chart by drawing a vertical line. Users can select their desired day of the month and customize the line color.
Features:
✅ Marks the chosen day of each month with a vertical line.
✅ Customizable line color (set in the indicator settings).
✅ Helps traders quickly identify key monthly dates.
Note: This indicator will not work on lower timeframes (e.g., 4H, 1H) and will show an error if applied outside the 1D timeframe.
Best Use Cases: Monthly trend tracking, economic event alignment, and custom date-based analysis. 🚀
릴리즈 노트
Day of Month Marker (1D Only)The Monthly Marker indicator automatically highlights a specific day of the month on a daily (1D) chart by drawing a vertical line. Users can select their desired day of the month and customize the line color.
If the selected day experiences a price change greater than a user-defined percentage, the line is highlighted in a different color.
Features:
✅ Marks the chosen day of each month with a vertical line.
✅ Highlights the line if the day's price change (open to close) exceeds the input threshold.
✅ Customizable colors for default and highlighted lines.
✅ Helps traders quickly identify key monthly dates.
Note: This indicator will not work on lower timeframes (e.g., 4H, 1H) and will show an error if applied outside the 1D timeframe.
Best Use Cases: Monthly trend tracking,economic event alignment, and custom date-based analysis. 🚀

면책사항
해당 정보와 게시물은 금융, 투자, 트레이딩 또는 기타 유형의 조언이나 권장 사항으로 간주되지 않으며, 트레이딩뷰에서 제공하거나 보증하는 것이 아닙니다. 자세한 내용은 이용 약관을 참조하세요.
면책사항
해당 정보와 게시물은 금융, 투자, 트레이딩 또는 기타 유형의 조언이나 권장 사항으로 간주되지 않으며, 트레이딩뷰에서 제공하거나 보증하는 것이 아닙니다. 자세한 내용은 이용 약관을 참조하세요.