Range Probability - NQ
1. What this indicator does
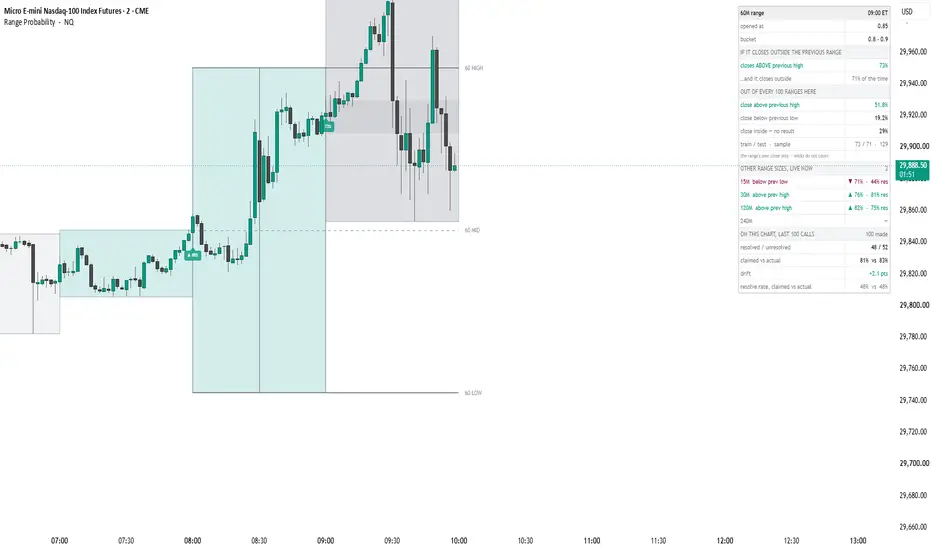
Range Probability — NQ splits the trading day into fixed-length time blocks ("ranges") and measures how each new range's opening price sits relative to the high and low of the range immediately before it. That relative position — from 0.0 (at the previous low) to 1.0 (at the previous high), with two extra states for opening below the low or at/above the high — is looked up against a table of historical outcomes for that exact range length, that exact time-of-day slot, and that exact opening bucket.
The lookup table tells you, historically, on NQ:
which side (above the previous high, or below the previous low) a range was more likely to close on when it closed outside the previous range at all, and how often that was, and
how often ranges in that specific slot actually resolved outside the previous range in the first place (as opposed to closing back inside it).
The script then:
draws the ranges as boxes, colour-coded by how they actually closed;
draws the previous range's high, mid, and low, plus its ten-decile grid, so you can see visually where price is relative to the range being measured against;
shades the decile that the new range opened in, since that decile is what the table result is drawn from;
prints a table with the looked-up conditional/unconditional probabilities, sample size, and a train/test split; and keeps a running scorecard, on the chart's own loaded history, of every call the script has made — comparing the probability it claimed against what actually happened, so you can see whether the historical edge is holding up or drifting on the data you're looking at.
This last part — auditing its own historical claims live, bar by bar, against realised outcomes — is the original piece: the indicator does not just assert a historical win rate, it continuously re-checks it in front of you and reports the resolved/unresolved count, the claimed-vs-live percentages, and the gap between them.
This is an analysis / statistics tool, not a buy/sell signal generator. It does not plot entries, exits, or strategy performance, and it is not a strategy script.
2. How the calculation works, step by step
Range construction. Ranges are built from a session anchor hour in New York time (default 18:00 ET, the standard futures session open) rather than from midnight. A 60-minute range setting, for example, produces ranges at 18:00, 19:00, 20:00 ET, and so on, regardless of the chart's own timeframe. The chart timeframe should be at or below the range size for the range boundaries to be tracked accurately intrabar; the table footer warns you if it isn't.
Opening position. When a new range opens, its open price is expressed as a fraction of the previous, already-closed range: open position = (new range open − previous range low) / (previous range high − previous range low) This is bucketed into 12 states: below the previous low, ten 0.1-wide deciles between the previous low and high, and at/above the previous high.
Historical lookup. Each combination of range length (15/30/60/120/240 min) × time-of-day slot × opening bucket maps to a pre-computed record: which direction (close above previous high, or close below previous low) was more common conditional on the range resolving outside the prior range at all, the probability of that on the training sample, the probability on a held-out test sample, the sample size, and the overall rate at which that slot/bucket actually resolves outside the previous range (versus closing back inside it, which the lookup treats as "no result"). These records were derived from historical NQ futures data and are fixed values compiled into the script — they are not recalculated from your chart's history.
Once a range opens, its bucket and lookup result are fixed for that range. They are computed a single time, from the open price and the already-completed previous range, and are not revised as the range develops. The box for the range continues to grow with price until the range closes, but the printed probability/direction for that range does not change or repaint after being set.
Live scorecard. Separately, and only for informational/audit purposes, the script keeps a rolling window (configurable size) of every call it has made on the currently loaded chart history, and checks, once each of those ranges has closed, whether the claimed direction and resolve rate actually happened. This produces the "claimed vs actual" and "drift" figures in the table — a live, out-of-sample check of the compiled historical table against the specific symbol/timeframe/session you have loaded.
3. Inputs & configuration
Range
Input Default Effect
Range size (minutes) 60 Which of the five pre-computed tables (15/30/60/120/240 min) is used, and how ranges are built.
Session anchor hour (ET) 18 The New York hour ranges are measured from. Must stay at 18:00 to match the compiled historical table — changing it moves the time-of-day slots out of alignment with the lookup data.
Ranges to keep on chart 20 How many historical range boxes remain drawn on the chart (does not affect calculations, only visuals/performance).
Box
Draw range boxes — toggles the boxes entirely.
Forming / Closed above previous high / Closed below previous low / Closed inside — colours for the box while forming, and after it closes, based on what actually happened (not on the prediction).
Levels
High / mid / low lines from the previous range — plots the previous range's high, midpoint, and low as reference lines.
Extend them this many ranges ahead — how far right those lines and the decile grid extend.
Label them — text labels on the high/mid/low lines.
Outline the previous range — draws a border box around the prior range for visual reference.
Open-position levels (0.0–1.0) — draws all ten internal decile lines of the previous range, not just the 0/50/100 lines.
Shade the bucket the range opened in — highlights the specific decile the new range's open falls into. This is a visual aid showing which cell the table result is being read from, not a trade signal in itself.
Colour/thickness controls for all of the above.
Table
Show table — toggles the on-chart statistics table.
Position / Text size — table placement and font size.
Show test outcome and sample size — adds the train/test/sample-size row so you can judge how much data a given cell's statistic rests on.
Signals
Label the chart when a cell qualifies — places a small up/down label with the looked-up probability when the new range's opening cell has a table match.
Fire an alert when a cell qualifies — creates a TradingView alert event (requires an alert to be set on the indicator with "Any alert() function call").
Scan the other range sizes for live signals — in parallel, evaluates the other four range lengths against the same lookup table and lists any of them that currently have a qualifying open, in the table's "other range sizes" section, purely for reference.
Live tracker
Track how the calls are doing on this chart — toggles the self-scoring rows described in Section 2.5.
Calls to keep in the window — how many of the most recent scored calls are included in the running average (does not change historical table values, only the live audit sample).
4. Reading the table
The table is built top to bottom in the following blocks:
Header — active range size and the current range's start time in ET.
Opened at / Bucket — the current range's normalized open position (0.00–1.00) and which of the 12 buckets it falls into.
"IF IT CLOSES OUTSIDE THE PREVIOUS RANGE" (conditional block)
The directional call (e.g. "closes ABOVE previous high") and the historical percentage of the ranges in this exact cell that did resolve outside the previous range, that went in that direction. This figure excludes ranges that closed back inside the previous range — it only compares "up outside" versus "down outside."
"…and it closes outside, X% of the time" — the base rate for this cell: how often a range in this slot/bucket resolves outside the previous range at all, versus staying inside it.
"OUT OF EVERY 100 RANGES HERE" (unconditional block) These three rows always sum to 100 and give the full picture without conditioning away the "closes inside" outcome:
close above previous high
close below previous low
close inside — no result
Train / test · sample — the probability on the training sample, the probability on a held-out test sample, and the number of historical ranges (N) the cell is based on. Cells with a small N are statistically weaker; use this row to judge confidence, not just the headline percentage.
Footer note — flags if your chart's own timeframe is coarser than the selected range size (which can distort intrabar range tracking), or otherwise notes that the calculation uses each range's own close only — wicks/intrabar excursions do not count toward the outcome.
"OTHER RANGE SIZES, LIVE NOW" — shows any of the other four range lengths that currently have a qualifying, in-progress opening cell, with their own probability and resolve rate, so you can see whether multiple range sizes are aligned.
"ON THIS CHART, LAST N CALLS" (live tracker)
Calls made, and how many have resolved vs are still open.
Claimed vs actual — the average probability the script displayed when each call was made, versus the percentage of those calls that were actually correct once resolved, on this chart's own history.
Drift — actual minus claimed, in percentage points. This is the single most important number for judging whether the compiled historical table is still representative of current conditions on the instrument/timeframe you're viewing.
Resolve rate, claimed vs actual — the same claimed-vs-actual comparison, but for how often ranges resolve outside the previous range at all (rather than for direction).
5. Alerts
With "Fire an alert when a cell qualifies" enabled, create a TradingView alert on this indicator using the "Any alert() function call" condition. The alert fires once per bar close, only on ranges whose opening cell has a match in the historical table, and includes the range size, time slot, opening position, direction, probability, and resolve rate in the message text.
6. Important limitations
The historical lookup table is fixed and was compiled from past NQ futures data. It is not recalculated from the chart you load it on. Past outcomes on this instrument do not guarantee similar outcomes going forward, and the live scorecard exists specifically so you can check, on your own chart, whether recent behaviour still matches the compiled history rather than assuming it does.
The table is keyed to the 18:00 ET session anchor. Changing the anchor hour moves every range's time-of-day slot out of alignment with the compiled data, and most or all cells will simply have no match.
Best matched to NQ. Applying it to other symbols will still run the mechanics (range construction, bucketing, box drawing), but the probabilities come from NQ's historical data and may not describe another instrument's behaviour. The live tracker will show this directly if the claimed-vs-actual figures drift on a different symbol.
Small samples exist for some cells. Some time-slot/bucket combinations have limited historical sample sizes (shown in the sample-size row); treat those cells with appropriate caution.
Only the close is used to judge outcomes. A range that wicks beyond the previous high or low intrabar but closes back inside it is scored as "closed inside," not as a directional resolution.
The chart's own timeframe should be at or below the selected range size. Using a coarser chart timeframe than the selected range can produce less accurate intrabar high/low tracking for the forming range; the table flags this.
This is a statistical/context tool, not financial advice and not a signal to trade on by itself. It reports historical conditional frequencies and their live, out-of-sample audit — nothing in the table constitutes a guarantee of future performance.
Range Probability — NQ splits the trading day into fixed-length time blocks ("ranges") and measures how each new range's opening price sits relative to the high and low of the range immediately before it. That relative position — from 0.0 (at the previous low) to 1.0 (at the previous high), with two extra states for opening below the low or at/above the high — is looked up against a table of historical outcomes for that exact range length, that exact time-of-day slot, and that exact opening bucket.
The lookup table tells you, historically, on NQ:
which side (above the previous high, or below the previous low) a range was more likely to close on when it closed outside the previous range at all, and how often that was, and
how often ranges in that specific slot actually resolved outside the previous range in the first place (as opposed to closing back inside it).
The script then:
draws the ranges as boxes, colour-coded by how they actually closed;
draws the previous range's high, mid, and low, plus its ten-decile grid, so you can see visually where price is relative to the range being measured against;
shades the decile that the new range opened in, since that decile is what the table result is drawn from;
prints a table with the looked-up conditional/unconditional probabilities, sample size, and a train/test split; and keeps a running scorecard, on the chart's own loaded history, of every call the script has made — comparing the probability it claimed against what actually happened, so you can see whether the historical edge is holding up or drifting on the data you're looking at.
This last part — auditing its own historical claims live, bar by bar, against realised outcomes — is the original piece: the indicator does not just assert a historical win rate, it continuously re-checks it in front of you and reports the resolved/unresolved count, the claimed-vs-live percentages, and the gap between them.
This is an analysis / statistics tool, not a buy/sell signal generator. It does not plot entries, exits, or strategy performance, and it is not a strategy script.
2. How the calculation works, step by step
Range construction. Ranges are built from a session anchor hour in New York time (default 18:00 ET, the standard futures session open) rather than from midnight. A 60-minute range setting, for example, produces ranges at 18:00, 19:00, 20:00 ET, and so on, regardless of the chart's own timeframe. The chart timeframe should be at or below the range size for the range boundaries to be tracked accurately intrabar; the table footer warns you if it isn't.
Opening position. When a new range opens, its open price is expressed as a fraction of the previous, already-closed range: open position = (new range open − previous range low) / (previous range high − previous range low) This is bucketed into 12 states: below the previous low, ten 0.1-wide deciles between the previous low and high, and at/above the previous high.
Historical lookup. Each combination of range length (15/30/60/120/240 min) × time-of-day slot × opening bucket maps to a pre-computed record: which direction (close above previous high, or close below previous low) was more common conditional on the range resolving outside the prior range at all, the probability of that on the training sample, the probability on a held-out test sample, the sample size, and the overall rate at which that slot/bucket actually resolves outside the previous range (versus closing back inside it, which the lookup treats as "no result"). These records were derived from historical NQ futures data and are fixed values compiled into the script — they are not recalculated from your chart's history.
Once a range opens, its bucket and lookup result are fixed for that range. They are computed a single time, from the open price and the already-completed previous range, and are not revised as the range develops. The box for the range continues to grow with price until the range closes, but the printed probability/direction for that range does not change or repaint after being set.
Live scorecard. Separately, and only for informational/audit purposes, the script keeps a rolling window (configurable size) of every call it has made on the currently loaded chart history, and checks, once each of those ranges has closed, whether the claimed direction and resolve rate actually happened. This produces the "claimed vs actual" and "drift" figures in the table — a live, out-of-sample check of the compiled historical table against the specific symbol/timeframe/session you have loaded.
3. Inputs & configuration
Range
Input Default Effect
Range size (minutes) 60 Which of the five pre-computed tables (15/30/60/120/240 min) is used, and how ranges are built.
Session anchor hour (ET) 18 The New York hour ranges are measured from. Must stay at 18:00 to match the compiled historical table — changing it moves the time-of-day slots out of alignment with the lookup data.
Ranges to keep on chart 20 How many historical range boxes remain drawn on the chart (does not affect calculations, only visuals/performance).
Box
Draw range boxes — toggles the boxes entirely.
Forming / Closed above previous high / Closed below previous low / Closed inside — colours for the box while forming, and after it closes, based on what actually happened (not on the prediction).
Levels
High / mid / low lines from the previous range — plots the previous range's high, midpoint, and low as reference lines.
Extend them this many ranges ahead — how far right those lines and the decile grid extend.
Label them — text labels on the high/mid/low lines.
Outline the previous range — draws a border box around the prior range for visual reference.
Open-position levels (0.0–1.0) — draws all ten internal decile lines of the previous range, not just the 0/50/100 lines.
Shade the bucket the range opened in — highlights the specific decile the new range's open falls into. This is a visual aid showing which cell the table result is being read from, not a trade signal in itself.
Colour/thickness controls for all of the above.
Table
Show table — toggles the on-chart statistics table.
Position / Text size — table placement and font size.
Show test outcome and sample size — adds the train/test/sample-size row so you can judge how much data a given cell's statistic rests on.
Signals
Label the chart when a cell qualifies — places a small up/down label with the looked-up probability when the new range's opening cell has a table match.
Fire an alert when a cell qualifies — creates a TradingView alert event (requires an alert to be set on the indicator with "Any alert() function call").
Scan the other range sizes for live signals — in parallel, evaluates the other four range lengths against the same lookup table and lists any of them that currently have a qualifying open, in the table's "other range sizes" section, purely for reference.
Live tracker
Track how the calls are doing on this chart — toggles the self-scoring rows described in Section 2.5.
Calls to keep in the window — how many of the most recent scored calls are included in the running average (does not change historical table values, only the live audit sample).
4. Reading the table
The table is built top to bottom in the following blocks:
Header — active range size and the current range's start time in ET.
Opened at / Bucket — the current range's normalized open position (0.00–1.00) and which of the 12 buckets it falls into.
"IF IT CLOSES OUTSIDE THE PREVIOUS RANGE" (conditional block)
The directional call (e.g. "closes ABOVE previous high") and the historical percentage of the ranges in this exact cell that did resolve outside the previous range, that went in that direction. This figure excludes ranges that closed back inside the previous range — it only compares "up outside" versus "down outside."
"…and it closes outside, X% of the time" — the base rate for this cell: how often a range in this slot/bucket resolves outside the previous range at all, versus staying inside it.
"OUT OF EVERY 100 RANGES HERE" (unconditional block) These three rows always sum to 100 and give the full picture without conditioning away the "closes inside" outcome:
close above previous high
close below previous low
close inside — no result
Train / test · sample — the probability on the training sample, the probability on a held-out test sample, and the number of historical ranges (N) the cell is based on. Cells with a small N are statistically weaker; use this row to judge confidence, not just the headline percentage.
Footer note — flags if your chart's own timeframe is coarser than the selected range size (which can distort intrabar range tracking), or otherwise notes that the calculation uses each range's own close only — wicks/intrabar excursions do not count toward the outcome.
"OTHER RANGE SIZES, LIVE NOW" — shows any of the other four range lengths that currently have a qualifying, in-progress opening cell, with their own probability and resolve rate, so you can see whether multiple range sizes are aligned.
"ON THIS CHART, LAST N CALLS" (live tracker)
Calls made, and how many have resolved vs are still open.
Claimed vs actual — the average probability the script displayed when each call was made, versus the percentage of those calls that were actually correct once resolved, on this chart's own history.
Drift — actual minus claimed, in percentage points. This is the single most important number for judging whether the compiled historical table is still representative of current conditions on the instrument/timeframe you're viewing.
Resolve rate, claimed vs actual — the same claimed-vs-actual comparison, but for how often ranges resolve outside the previous range at all (rather than for direction).
5. Alerts
With "Fire an alert when a cell qualifies" enabled, create a TradingView alert on this indicator using the "Any alert() function call" condition. The alert fires once per bar close, only on ranges whose opening cell has a match in the historical table, and includes the range size, time slot, opening position, direction, probability, and resolve rate in the message text.
6. Important limitations
The historical lookup table is fixed and was compiled from past NQ futures data. It is not recalculated from the chart you load it on. Past outcomes on this instrument do not guarantee similar outcomes going forward, and the live scorecard exists specifically so you can check, on your own chart, whether recent behaviour still matches the compiled history rather than assuming it does.
The table is keyed to the 18:00 ET session anchor. Changing the anchor hour moves every range's time-of-day slot out of alignment with the compiled data, and most or all cells will simply have no match.
Best matched to NQ. Applying it to other symbols will still run the mechanics (range construction, bucketing, box drawing), but the probabilities come from NQ's historical data and may not describe another instrument's behaviour. The live tracker will show this directly if the claimed-vs-actual figures drift on a different symbol.
Small samples exist for some cells. Some time-slot/bucket combinations have limited historical sample sizes (shown in the sample-size row); treat those cells with appropriate caution.
Only the close is used to judge outcomes. A range that wicks beyond the previous high or low intrabar but closes back inside it is scored as "closed inside," not as a directional resolution.
The chart's own timeframe should be at or below the selected range size. Using a coarser chart timeframe than the selected range can produce less accurate intrabar high/low tracking for the forming range; the table flags this.
This is a statistical/context tool, not financial advice and not a signal to trade on by itself. It reports historical conditional frequencies and their live, out-of-sample audit — nothing in the table constitutes a guarantee of future performance.

면책사항
해당 정보와 게시물은 금융, 투자, 트레이딩 또는 기타 유형의 조언이나 권장 사항으로 간주되지 않으며, 트레이딩뷰에서 제공하거나 보증하는 것이 아닙니다. 자세한 내용은 이용 약관을 참조하세요.
면책사항
해당 정보와 게시물은 금융, 투자, 트레이딩 또는 기타 유형의 조언이나 권장 사항으로 간주되지 않으며, 트레이딩뷰에서 제공하거나 보증하는 것이 아닙니다. 자세한 내용은 이용 약관을 참조하세요.