OPEN-SOURCE SCRIPT
DCA Accumulator
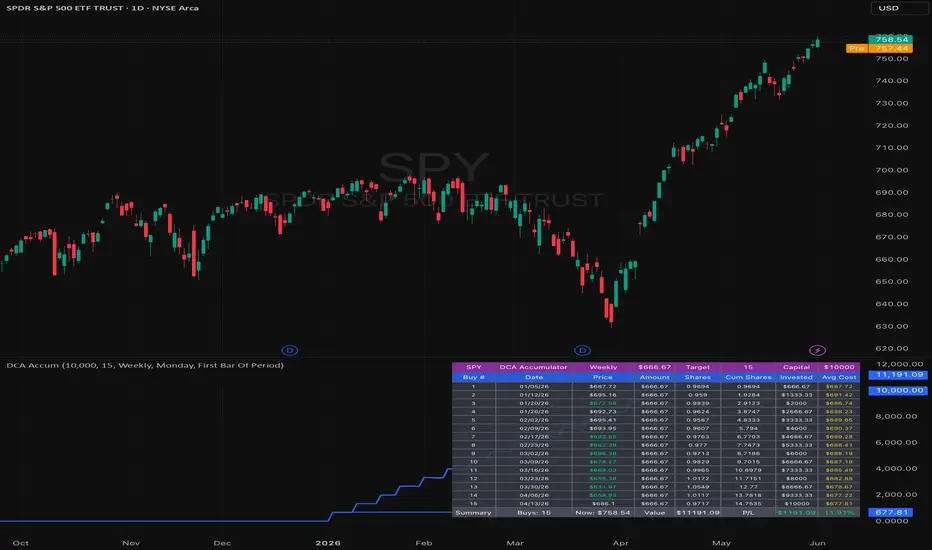
DCA Accumulator is a portfolio tracking indicator designed to help visualize a dollar-cost averaging plan on the currently selected chart symbol.
The script calculates scheduled purchases based on user-defined settings such as total capital, target number of buys, start date, buy frequency, and buy timing. The DCA amount is automatically calculated from the capital deployed divided by the target number of buys.
The indicator tracks:
* Number of completed buys
* Purchase date
* Purchase price
* Amount invested per buy
* Shares accumulated
* Total invested capital
* Average cost
* Current estimated position value
* Unrealized profit or loss
This tool is intended for planning, tracking, and educational analysis only. It does not generate buy or sell signals, does not predict future price movement, and does not guarantee any outcome. Values are based on chart data and the selected settings, so results may vary depending on symbol, timeframe, available history, and market conditions.
Past performance and historical chart behavior do not guarantee future results. This indicator should be used as one part of a broader research and risk management process, not as financial advice or a recommendation to buy, sell, or hold any asset.
The script calculates scheduled purchases based on user-defined settings such as total capital, target number of buys, start date, buy frequency, and buy timing. The DCA amount is automatically calculated from the capital deployed divided by the target number of buys.
The indicator tracks:
* Number of completed buys
* Purchase date
* Purchase price
* Amount invested per buy
* Shares accumulated
* Total invested capital
* Average cost
* Current estimated position value
* Unrealized profit or loss
This tool is intended for planning, tracking, and educational analysis only. It does not generate buy or sell signals, does not predict future price movement, and does not guarantee any outcome. Values are based on chart data and the selected settings, so results may vary depending on symbol, timeframe, available history, and market conditions.
Past performance and historical chart behavior do not guarantee future results. This indicator should be used as one part of a broader research and risk management process, not as financial advice or a recommendation to buy, sell, or hold any asset.
오픈 소스 스크립트
트레이딩뷰의 진정한 정신에 따라, 이 스크립트의 작성자는 이를 오픈소스로 공개하여 트레이더들이 기능을 검토하고 검증할 수 있도록 했습니다. 작성자에게 찬사를 보냅니다! 이 코드는 무료로 사용할 수 있지만, 코드를 재게시하는 경우 하우스 룰이 적용된다는 점을 기억하세요.

Independent market structure tools and educational chart analysis for learning and review only. Not financial advice.
면책사항
해당 정보와 게시물은 금융, 투자, 트레이딩 또는 기타 유형의 조언이나 권장 사항으로 간주되지 않으며, 트레이딩뷰에서 제공하거나 보증하는 것이 아닙니다. 자세한 내용은 이용 약관을 참조하세요.
오픈 소스 스크립트
트레이딩뷰의 진정한 정신에 따라, 이 스크립트의 작성자는 이를 오픈소스로 공개하여 트레이더들이 기능을 검토하고 검증할 수 있도록 했습니다. 작성자에게 찬사를 보냅니다! 이 코드는 무료로 사용할 수 있지만, 코드를 재게시하는 경우 하우스 룰이 적용된다는 점을 기억하세요.
Independent market structure tools and educational chart analysis for learning and review only. Not financial advice.
면책사항
해당 정보와 게시물은 금융, 투자, 트레이딩 또는 기타 유형의 조언이나 권장 사항으로 간주되지 않으며, 트레이딩뷰에서 제공하거나 보증하는 것이 아닙니다. 자세한 내용은 이용 약관을 참조하세요.