CTZ RSI Divergence Pro
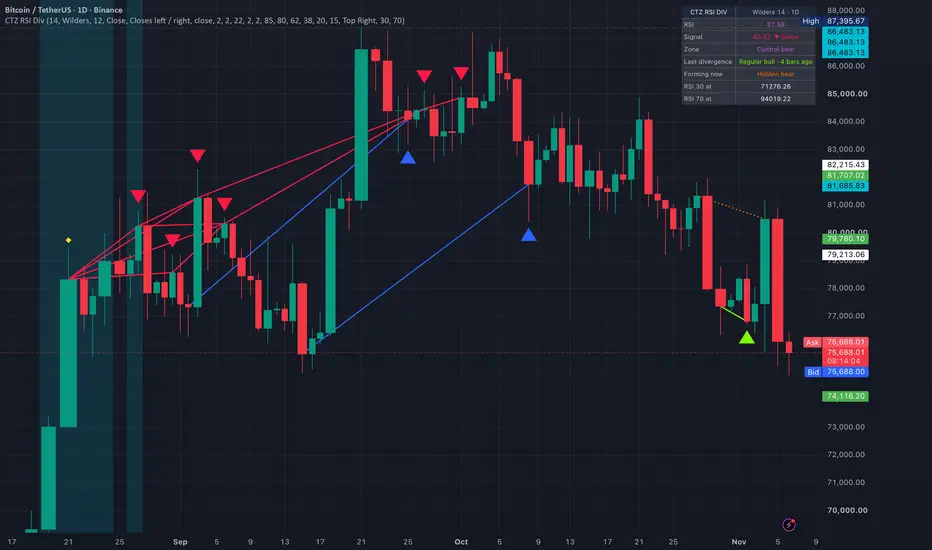
CTZ RSI Divergence Pro
Regular and hidden RSI divergence, drawn straight onto the price chart.
━━━━━━━━━━━━━━━━━━
WHAT IT DOES
━━━━━━━━━━━━━━━━━━
Finds RSI divergence between local highs and lows and draws it on the candles, so you don't need to watch a separate RSI pane.
Local highs and lows are defined by candle CLOSES, not wicks, which filters out stop hunts and liquidation spikes. Each new high or low is compared with every earlier one inside the lookback, and every divergence found is drawn.
━━━━━━━━━━━━━━━━━━
THE 4 DIVERGENCES
━━━━━━━━━━━━━━━━━━
🟢 Regular bull: price lower low, RSI higher low → selling is weakening, possible reversal up
🔴 Regular bear: price higher high, RSI lower high → buying is weakening, possible reversal down
🔵 Hidden bull: price higher low, RSI lower low → uptrend likely to continue
🟠 Hidden bear: price lower high, RSI higher high → downtrend likely to continue
Regular = reversal signal. Hidden = continuation signal.
━━━━━━━━━━━━━━━━━━
HOW IT CONFIRMS
━━━━━━━━━━━━━━━━━━
• A local high is a close above the closes on each side (default: 2 left, 2 right)
• It's only confirmed once the right-side candles have CLOSED. No confirming on a live candle
• Solid line = confirmed divergence
• Dotted line = divergence still forming (the high or low is waiting for its confirming closes)
• A forming high only counts once a later candle has closed below its low wick (reverse for lows)
• Only one forming divergence shows at a time: the most recent
━━━━━━━━━━━━━━━━━━
ON THE CHART
━━━━━━━━━━━━━━━━━━
• Coloured arrows: where a divergence is confirmed
• White arrows: every confirmed high and low (no divergence)
• Small dots: where each divergence line starts
• Candle background: RSI critical zones (and optional control zones)
• Yellow diamonds: RSI crossing the alert levels
━━━━━━━━━━━━━━━━━━
INFOBOX
━━━━━━━━━━━━━━━━━━
• RSI and signal line (above / below)
• Current RSI zone
• Last confirmed divergence and how many bars ago
• Divergence forming now
• TEST PRICE: the exact price the current candle must close at for RSI to hit your chosen level. Great for knowing in advance where RSI hits oversold or overbought
━━━━━━━━━━━━━━━━━━
SETTINGS
━━━━━━━━━━━━━━━━━━
• RSI: Wilders, Cutler (SMA) or EMA, length 14, signal line EMA 12
• Divergence source: closes or wicks
• Closes left / right to define a high or low
• Lookback: how far back to compare highs and lows (default 22)
• Alternative confirmation: "Close beyond wick (zigzag)", where highs and lows alternate
• External source: run divergence on any other indicator (CVD, OBV, etc.) instead of RSI
• Optional midline filter: regular bull only below 50, regular bear only above 50
• Optional: let the live candle start a forming divergence (earlier, but more false signals)
• Zone levels: 85 / 80 / 62 / 50 / 38 / 20 / 15 (all adjustable)
━━━━━━━━━━━━━━━━━━
ALERTS
━━━━━━━━━━━━━━━━━━
High / low confirmed • Potential divergence • Confirmed divergence • RSI crosses 50 • RSI crosses signal line
(Create one alert using "Any alert() function call")
Data window outputs: the 4 confirmed divergences (1 on the confirming bar) for use in strategies and other scripts.
━━━━━━━━━━━━━━━━━━
HOW TO USE IT
━━━━━━━━━━━━━━━━━━
1. Treat a dotted line as a heads-up. Act on solid (confirmed) divergences
2. Regular divergence at key levels and RSI extremes = strongest reversal signals
3. Hidden divergence in a clear trend = a pullback entry in the trend's direction
4. Divergence on higher timeframes (Daily, 3D, Weekly) carries much more weight
5. Combine it with structure, levels and volume. Divergence shows momentum is fading, not the exact turn
⚠️ For educational purposes only. Not financial advice.
```
Regular and hidden RSI divergence, drawn straight onto the price chart.
━━━━━━━━━━━━━━━━━━
WHAT IT DOES
━━━━━━━━━━━━━━━━━━
Finds RSI divergence between local highs and lows and draws it on the candles, so you don't need to watch a separate RSI pane.
Local highs and lows are defined by candle CLOSES, not wicks, which filters out stop hunts and liquidation spikes. Each new high or low is compared with every earlier one inside the lookback, and every divergence found is drawn.
━━━━━━━━━━━━━━━━━━
THE 4 DIVERGENCES
━━━━━━━━━━━━━━━━━━
🟢 Regular bull: price lower low, RSI higher low → selling is weakening, possible reversal up
🔴 Regular bear: price higher high, RSI lower high → buying is weakening, possible reversal down
🔵 Hidden bull: price higher low, RSI lower low → uptrend likely to continue
🟠 Hidden bear: price lower high, RSI higher high → downtrend likely to continue
Regular = reversal signal. Hidden = continuation signal.
━━━━━━━━━━━━━━━━━━
HOW IT CONFIRMS
━━━━━━━━━━━━━━━━━━
• A local high is a close above the closes on each side (default: 2 left, 2 right)
• It's only confirmed once the right-side candles have CLOSED. No confirming on a live candle
• Solid line = confirmed divergence
• Dotted line = divergence still forming (the high or low is waiting for its confirming closes)
• A forming high only counts once a later candle has closed below its low wick (reverse for lows)
• Only one forming divergence shows at a time: the most recent
━━━━━━━━━━━━━━━━━━
ON THE CHART
━━━━━━━━━━━━━━━━━━
• Coloured arrows: where a divergence is confirmed
• White arrows: every confirmed high and low (no divergence)
• Small dots: where each divergence line starts
• Candle background: RSI critical zones (and optional control zones)
• Yellow diamonds: RSI crossing the alert levels
━━━━━━━━━━━━━━━━━━
INFOBOX
━━━━━━━━━━━━━━━━━━
• RSI and signal line (above / below)
• Current RSI zone
• Last confirmed divergence and how many bars ago
• Divergence forming now
• TEST PRICE: the exact price the current candle must close at for RSI to hit your chosen level. Great for knowing in advance where RSI hits oversold or overbought
━━━━━━━━━━━━━━━━━━
SETTINGS
━━━━━━━━━━━━━━━━━━
• RSI: Wilders, Cutler (SMA) or EMA, length 14, signal line EMA 12
• Divergence source: closes or wicks
• Closes left / right to define a high or low
• Lookback: how far back to compare highs and lows (default 22)
• Alternative confirmation: "Close beyond wick (zigzag)", where highs and lows alternate
• External source: run divergence on any other indicator (CVD, OBV, etc.) instead of RSI
• Optional midline filter: regular bull only below 50, regular bear only above 50
• Optional: let the live candle start a forming divergence (earlier, but more false signals)
• Zone levels: 85 / 80 / 62 / 50 / 38 / 20 / 15 (all adjustable)
━━━━━━━━━━━━━━━━━━
ALERTS
━━━━━━━━━━━━━━━━━━
High / low confirmed • Potential divergence • Confirmed divergence • RSI crosses 50 • RSI crosses signal line
(Create one alert using "Any alert() function call")
Data window outputs: the 4 confirmed divergences (1 on the confirming bar) for use in strategies and other scripts.
━━━━━━━━━━━━━━━━━━
HOW TO USE IT
━━━━━━━━━━━━━━━━━━
1. Treat a dotted line as a heads-up. Act on solid (confirmed) divergences
2. Regular divergence at key levels and RSI extremes = strongest reversal signals
3. Hidden divergence in a clear trend = a pullback entry in the trend's direction
4. Divergence on higher timeframes (Daily, 3D, Weekly) carries much more weight
5. Combine it with structure, levels and volume. Divergence shows momentum is fading, not the exact turn
⚠️ For educational purposes only. Not financial advice.
```

면책사항
해당 정보와 게시물은 금융, 투자, 트레이딩 또는 기타 유형의 조언이나 권장 사항으로 간주되지 않으며, 트레이딩뷰에서 제공하거나 보증하는 것이 아닙니다. 자세한 내용은 이용 약관을 참조하세요.
면책사항
해당 정보와 게시물은 금융, 투자, 트레이딩 또는 기타 유형의 조언이나 권장 사항으로 간주되지 않으며, 트레이딩뷰에서 제공하거나 보증하는 것이 아닙니다. 자세한 내용은 이용 약관을 참조하세요.