KAMA Ribbon [Yaro]
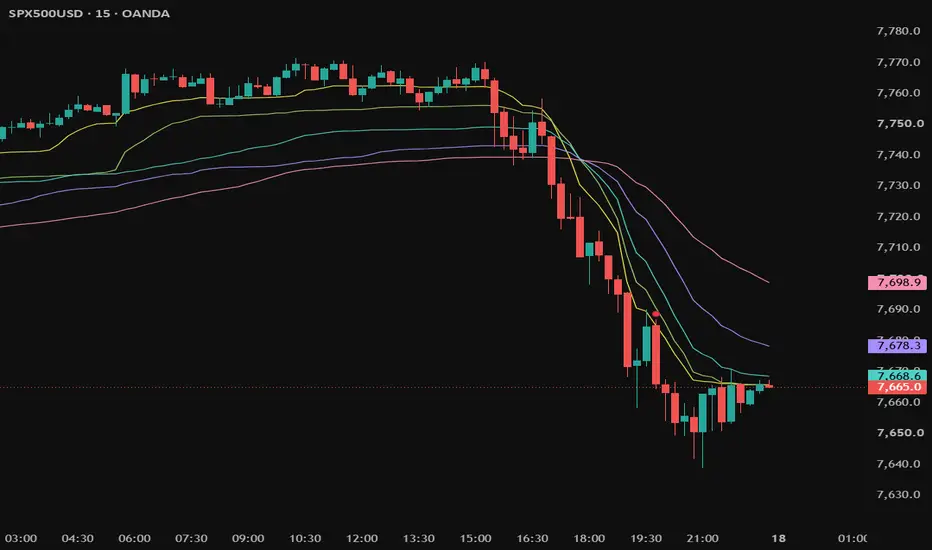
Up to five adaptive moving averages (Kaufman's KAMA) from fast to slow. Each line speeds up when price trends cleanly and slows down in chop, so the ribbon opens in a trend and tangles in a range.
What it draws
How it works
Settings
Notes
What it draws
- KAMA 1-5: one line each, fast to slow, colored yellow, green, teal, violet, pink. KAMA 1 is on by default.
How it works
- ER (efficiency ratio): over the last ER bars, how straight price moved. A straight move makes the line fast, chop makes it slow.
- Spacing: ER sets each line's pace, so the defaults grow ER with Slow (10 / 17 / 27 / 43 / 67 with Slow 30 / 50 / 80 / 130 / 200). With one ER for all, the lines lie on top of each other.
Settings
- KAMA Lines: Source, Timeframe, and per line ER, Fast and Slow.
- Colors & Lines: Theme, line colors, Line Style, Line Width.
Notes
- A higher timeframe is read from closed bars, so the lines do not repaint.
- Tested on S&P 500 and Nasdaq 100 (M15, H1): with the defaults, neighbouring lines sit 0.4-0.8 ATR apart and each turns less often than the one before. The ribbon shows trend and pace; it is not a trade signal.
- Same KAMA formula as KAMA Channel.

면책사항
해당 정보와 게시물은 금융, 투자, 트레이딩 또는 기타 유형의 조언이나 권장 사항으로 간주되지 않으며, 트레이딩뷰에서 제공하거나 보증하는 것이 아닙니다. 자세한 내용은 이용 약관을 참조하세요.
면책사항
해당 정보와 게시물은 금융, 투자, 트레이딩 또는 기타 유형의 조언이나 권장 사항으로 간주되지 않으며, 트레이딩뷰에서 제공하거나 보증하는 것이 아닙니다. 자세한 내용은 이용 약관을 참조하세요.