Volume Pulse & Average - CK
Short Description:
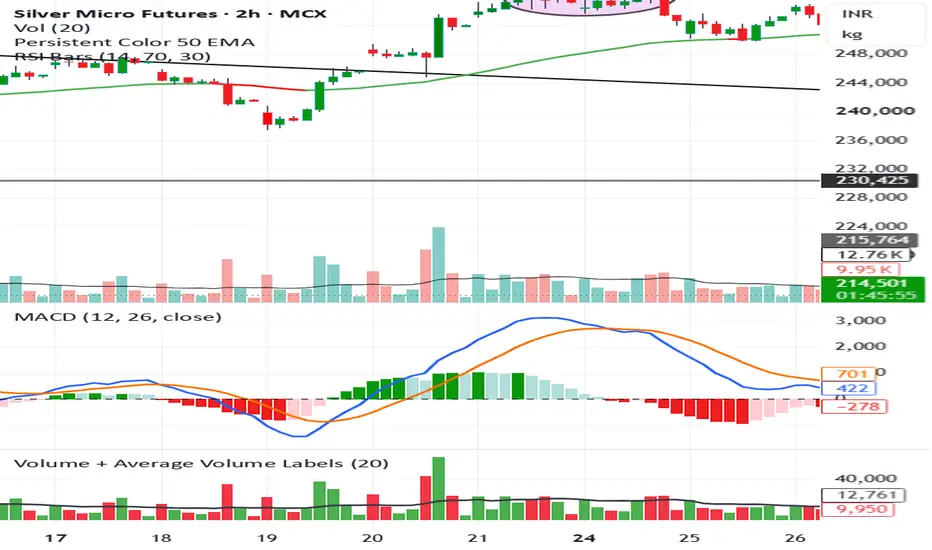
Volume Pulse is a simple volume analysis indicator that visually distinguishes bullish and bearish candle volume while tracking the 20-period average volume.
Full Description:
Volume Pulse & Average is a volume analysis tool designed to help traders quickly assess trading activity and compare current volume against its moving average.
Key Features:
🟢 Bullish Volume: Green columns represent volume on bullish candles.
🔴 Bearish Volume: Red columns represent volume on bearish candles.
⚫ Average Volume Line: A black moving-average line displays the average volume over the selected period.
Volume Labels: Displays individual candle volume values directly on the volume bars.
Average Volume Labels: Shows the corresponding average-volume values for quick comparison.
Customizable Settings: Adjust the moving-average period and enable or disable labels as needed.
How to Use:
Compare each candle's volume with the average-volume line to identify periods of relatively high or low trading activity. Observe whether increasing volume accompanies bullish or bearish price movement for additional market context.
Disclaimer: This indicator is intended for technical analysis and educational purposes only. Volume alone does not guarantee price direction or a profitable trade. Use it alongside price action and your trading strategy.
Author's Note: A straightforward volume visualization tool designed for traders who prefer a clean, color-coded view of market participation.
Volume Pulse is a simple volume analysis indicator that visually distinguishes bullish and bearish candle volume while tracking the 20-period average volume.
Full Description:
Volume Pulse & Average is a volume analysis tool designed to help traders quickly assess trading activity and compare current volume against its moving average.
Key Features:
🟢 Bullish Volume: Green columns represent volume on bullish candles.
🔴 Bearish Volume: Red columns represent volume on bearish candles.
⚫ Average Volume Line: A black moving-average line displays the average volume over the selected period.
Volume Labels: Displays individual candle volume values directly on the volume bars.
Average Volume Labels: Shows the corresponding average-volume values for quick comparison.
Customizable Settings: Adjust the moving-average period and enable or disable labels as needed.
How to Use:
Compare each candle's volume with the average-volume line to identify periods of relatively high or low trading activity. Observe whether increasing volume accompanies bullish or bearish price movement for additional market context.
Disclaimer: This indicator is intended for technical analysis and educational purposes only. Volume alone does not guarantee price direction or a profitable trade. Use it alongside price action and your trading strategy.
Author's Note: A straightforward volume visualization tool designed for traders who prefer a clean, color-coded view of market participation.

면책사항
해당 정보와 게시물은 금융, 투자, 트레이딩 또는 기타 유형의 조언이나 권장 사항으로 간주되지 않으며, 트레이딩뷰에서 제공하거나 보증하는 것이 아닙니다. 자세한 내용은 이용 약관을 참조하세요.
면책사항
해당 정보와 게시물은 금융, 투자, 트레이딩 또는 기타 유형의 조언이나 권장 사항으로 간주되지 않으며, 트레이딩뷰에서 제공하거나 보증하는 것이 아닙니다. 자세한 내용은 이용 약관을 참조하세요.