OPEN-SOURCE SCRIPT
업데이트됨 Average Price / Time
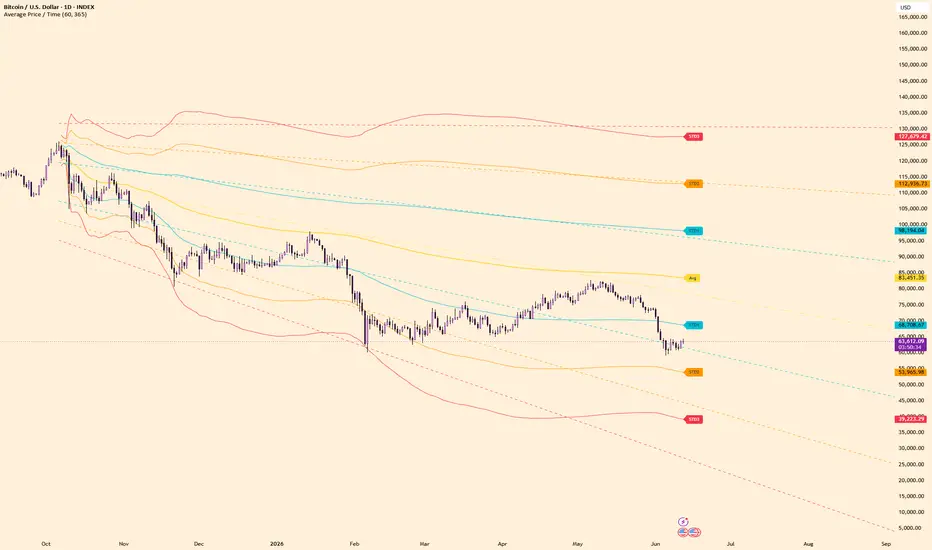
Average Price / Time calculates an anchored time-at-price average from a selected starting candle.
The script uses 1-hour candle ranges by default and treats time as evenly distributed across each candle’s high-low range. From the selected anchor point, it calculates the average price and plots standard deviation bands around it.
Features:
- Mouse-selected start candle
- Time-at-price average
- STD1, STD2, and STD3 bands
- Current z-score shown in the data window
Note:
This is a time-at-price approximation, not a volume-weighted calculation. It measures where price spent time, not where the most volume traded.
The script uses 1-hour candle ranges by default and treats time as evenly distributed across each candle’s high-low range. From the selected anchor point, it calculates the average price and plots standard deviation bands around it.
Features:
- Mouse-selected start candle
- Time-at-price average
- STD1, STD2, and STD3 bands
- Current z-score shown in the data window
Note:
This is a time-at-price approximation, not a volume-weighted calculation. It measures where price spent time, not where the most volume traded.
릴리즈 노트
Added linear-regression projection tools for Avg and standard deviation levels.The indicator now calculates regression slopes for Avg, STD1, STD2, and STD3 levels from the anchored period and draws forward projection lines based on those fitted trends.
Projection length is user configurable, and projected slopes are available in the data window.
오픈 소스 스크립트
트레이딩뷰의 진정한 정신에 따라, 이 스크립트의 작성자는 이를 오픈소스로 공개하여 트레이더들이 기능을 검토하고 검증할 수 있도록 했습니다. 작성자에게 찬사를 보냅니다! 이 코드는 무료로 사용할 수 있지만, 코드를 재게시하는 경우 하우스 룰이 적용된다는 점을 기억하세요.

면책사항
해당 정보와 게시물은 금융, 투자, 트레이딩 또는 기타 유형의 조언이나 권장 사항으로 간주되지 않으며, 트레이딩뷰에서 제공하거나 보증하는 것이 아닙니다. 자세한 내용은 이용 약관을 참조하세요.
오픈 소스 스크립트
트레이딩뷰의 진정한 정신에 따라, 이 스크립트의 작성자는 이를 오픈소스로 공개하여 트레이더들이 기능을 검토하고 검증할 수 있도록 했습니다. 작성자에게 찬사를 보냅니다! 이 코드는 무료로 사용할 수 있지만, 코드를 재게시하는 경우 하우스 룰이 적용된다는 점을 기억하세요.
면책사항
해당 정보와 게시물은 금융, 투자, 트레이딩 또는 기타 유형의 조언이나 권장 사항으로 간주되지 않으며, 트레이딩뷰에서 제공하거나 보증하는 것이 아닙니다. 자세한 내용은 이용 약관을 참조하세요.