OPEN-SOURCE SCRIPT
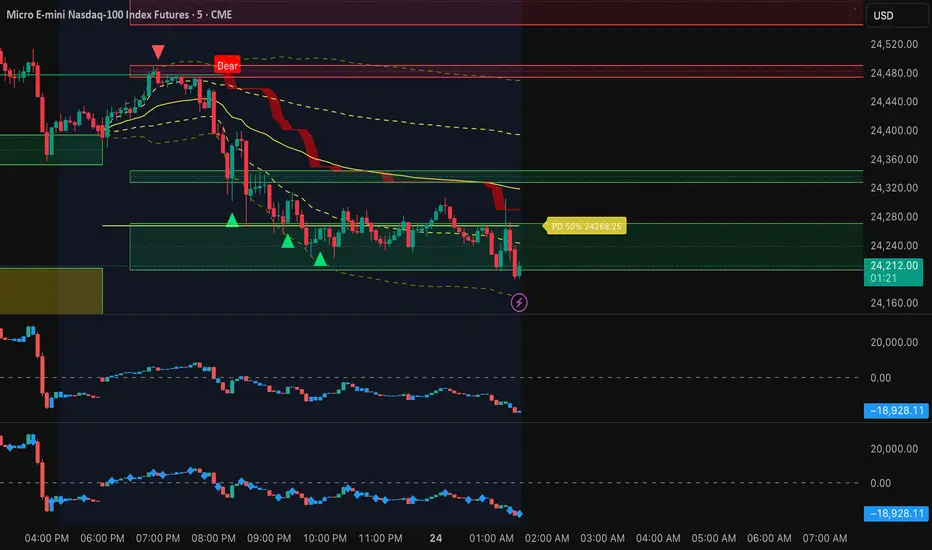
CVD Candles.
█ WHAT IS CVD?
Cumulative Volume Delta (CVD) tracks the running total of buying volume minus selling volume. It reveals who's in control — buyers or sellers — beyond what price alone shows.
█ HOW IT WORKS
Each candle represents the cumulative delta:
• Delta = Buy Volume − Sell Volume
• CVD = Running sum of delta
This creates a "price chart" of order flow, making it easy to spot divergences between price and actual buying/selling pressure.
█ 3-COLOR SYSTEM
🟢 GREEN — Strong Bullish
Price closed above previous bar's high. Buyers in control.
🔴 RED — Strong Bearish
Price closed below previous bar's low. Sellers in control.
🔵 BLUE — Neutral (Reversal Signal)
Price closed between previous high/low. Momentum pausing — watch for potential reversal.
█ HOW TO USE
1. TREND CONFIRMATION
Price up + CVD up (green) = Strong trend ✓
Price up + CVD down (red) = Weak trend, possible reversal
2. DIVERGENCE
Price making new highs but CVD declining = Bearish divergence
Price making new lows but CVD rising = Bullish divergence
3. REVERSAL SIGNALS
Blue candles indicate momentum pause — often precede reversals
█ SETTINGS
• Reset Daily: Resets CVD at each session start
• Works best on futures, stocks, and crypto with volume data
█ CREDITS
Inspired by Bookmap's Cumulative Delta indicator.
Cumulative Volume Delta (CVD) tracks the running total of buying volume minus selling volume. It reveals who's in control — buyers or sellers — beyond what price alone shows.
█ HOW IT WORKS
Each candle represents the cumulative delta:
• Delta = Buy Volume − Sell Volume
• CVD = Running sum of delta
This creates a "price chart" of order flow, making it easy to spot divergences between price and actual buying/selling pressure.
█ 3-COLOR SYSTEM
🟢 GREEN — Strong Bullish
Price closed above previous bar's high. Buyers in control.
🔴 RED — Strong Bearish
Price closed below previous bar's low. Sellers in control.
🔵 BLUE — Neutral (Reversal Signal)
Price closed between previous high/low. Momentum pausing — watch for potential reversal.
█ HOW TO USE
1. TREND CONFIRMATION
Price up + CVD up (green) = Strong trend ✓
Price up + CVD down (red) = Weak trend, possible reversal
2. DIVERGENCE
Price making new highs but CVD declining = Bearish divergence
Price making new lows but CVD rising = Bullish divergence
3. REVERSAL SIGNALS
Blue candles indicate momentum pause — often precede reversals
█ SETTINGS
• Reset Daily: Resets CVD at each session start
• Works best on futures, stocks, and crypto with volume data
█ CREDITS
Inspired by Bookmap's Cumulative Delta indicator.
오픈 소스 스크립트
트레이딩뷰의 진정한 정신에 따라, 이 스크립트의 작성자는 이를 오픈소스로 공개하여 트레이더들이 기능을 검토하고 검증할 수 있도록 했습니다. 작성자에게 찬사를 보냅니다! 이 코드는 무료로 사용할 수 있지만, 코드를 재게시하는 경우 하우스 룰이 적용된다는 점을 기억하세요.

면책사항
해당 정보와 게시물은 금융, 투자, 트레이딩 또는 기타 유형의 조언이나 권장 사항으로 간주되지 않으며, 트레이딩뷰에서 제공하거나 보증하는 것이 아닙니다. 자세한 내용은 이용 약관을 참조하세요.
오픈 소스 스크립트
트레이딩뷰의 진정한 정신에 따라, 이 스크립트의 작성자는 이를 오픈소스로 공개하여 트레이더들이 기능을 검토하고 검증할 수 있도록 했습니다. 작성자에게 찬사를 보냅니다! 이 코드는 무료로 사용할 수 있지만, 코드를 재게시하는 경우 하우스 룰이 적용된다는 점을 기억하세요.
면책사항
해당 정보와 게시물은 금융, 투자, 트레이딩 또는 기타 유형의 조언이나 권장 사항으로 간주되지 않으며, 트레이딩뷰에서 제공하거나 보증하는 것이 아닙니다. 자세한 내용은 이용 약관을 참조하세요.