업데이트됨
Multi-Timeframe 200 EMA
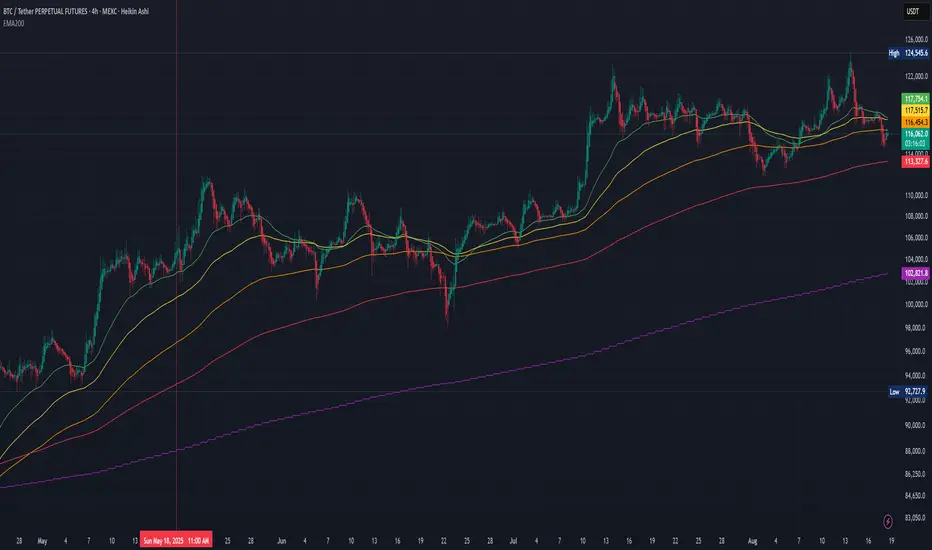
Multi-Timeframe 200 EMA Indicator
This indicator plots five 200-period Exponential Moving Averages (EMAs) on your chart, each from a different timeframe: 1-hour, 2-hour, 4-hour, 8-hour, and 1-day.
What It Does:
Analyzes Higher Timeframes: It uses the request.security() function to fetch data from higher timeframes. This allows you to see significant long-term support and resistance levels from higher timeframes, all on your current chart.
Customizable: You can easily turn each EMA line on or off individually in the indicator's settings. By default, the 1-hour and 1-day EMAs are off, so you can focus on the intermediate timeframes right away.
Clean and Simple: The indicator is designed to be clean and easy to read, with different colors for each EMA line to help you quickly identify the different timeframes at a glance.
This is a powerful tool for trend analysis and identifying key price levels, helping you make more informed trading decisions.
릴리즈 노트
This indicator displays five 200-period Exponential Moving Averages (EMAs), each calculated from a different timeframe and plotted on the current chart. It's designed to help traders visualize long-term trend alignment across multiple timeframes without switching charts.🧠 Key Features:
EMAs: Pulls 200-period EMAs from:
1 Hour (1H)
2 Hour (2H)
4 Hour (4H)
8 Hour (8H)
1 Day (1D)
Toggle Visibility: Easily enable or disable each EMA via settings
Minimalist Styling: Thin lines (linewidth = 1) for a clean, unobtrusive overlay
📈 Use Case:
This tool is ideal for traders who want to:
Identify confluence zones across timeframes
Spot long-term support/resistance levels
Confirm trend strength and direction
Avoid chart clutter while maintaining multi-timeframe awareness

면책사항
해당 정보와 게시물은 금융, 투자, 트레이딩 또는 기타 유형의 조언이나 권장 사항으로 간주되지 않으며, 트레이딩뷰에서 제공하거나 보증하는 것이 아닙니다. 자세한 내용은 이용 약관을 참조하세요.
면책사항
해당 정보와 게시물은 금융, 투자, 트레이딩 또는 기타 유형의 조언이나 권장 사항으로 간주되지 않으며, 트레이딩뷰에서 제공하거나 보증하는 것이 아닙니다. 자세한 내용은 이용 약관을 참조하세요.