OPEN-SOURCE SCRIPT
Auto Structure Lines
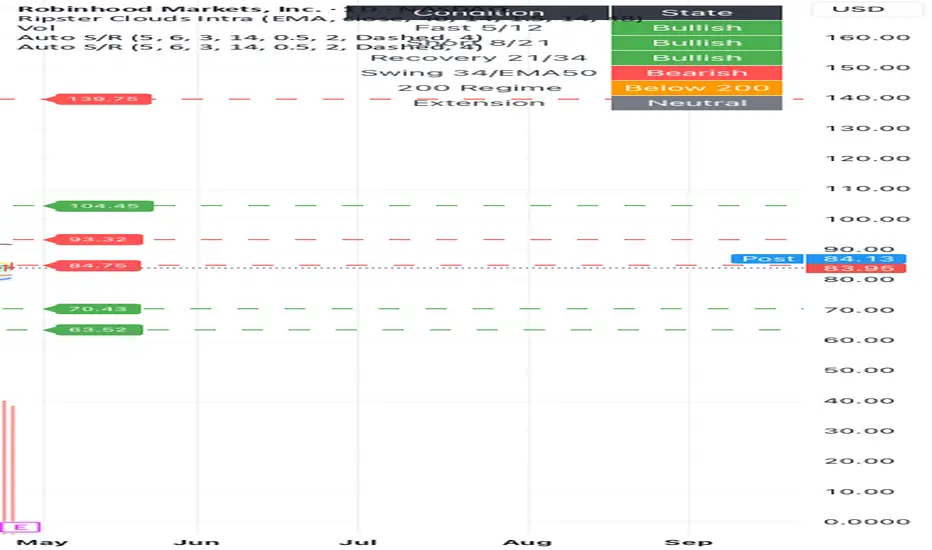
Auto Structure Lines automatically detects recent swing highs and swing lows, then plots clean support and resistance levels on the chart. It is designed to help traders quickly identify nearby structure, breakout areas, rejection zones, and possible pullback levels without manually drawing every line.
The indicator uses confirmed pivot highs and lows to create resistance and support lines. Nearby levels are merged using an ATR-based tolerance so the chart stays cleaner and avoids stacking multiple lines around the same price area.
Key features:
Automatically detects pivot-based support and resistance
Extends structure lines to the right side of the chart
Stores multiple historical levels while showing only the most recent visible levels
ATR-based level merging to reduce clutter
Optional price labels for each visible level
Customizable pivot length, line style, colors, width, and label offset
Separate toggles for support and resistance
This tool is useful for identifying important price areas, planning breakout entries, watching retests, and managing risk around nearby support or resistance.
Auto Structure Lines is a visual decision-support tool. It does not generate buy or sell signals by itself and should be used with price action, volume, trend context, and your own risk management.
오픈 소스 스크립트
트레이딩뷰의 진정한 정신에 따라, 이 스크립트의 작성자는 이를 오픈소스로 공개하여 트레이더들이 기능을 검토하고 검증할 수 있도록 했습니다. 작성자에게 찬사를 보냅니다! 이 코드는 무료로 사용할 수 있지만, 코드를 재게시하는 경우 하우스 룰이 적용된다는 점을 기억하세요.

면책사항
해당 정보와 게시물은 금융, 투자, 트레이딩 또는 기타 유형의 조언이나 권장 사항으로 간주되지 않으며, 트레이딩뷰에서 제공하거나 보증하는 것이 아닙니다. 자세한 내용은 이용 약관을 참조하세요.
오픈 소스 스크립트
트레이딩뷰의 진정한 정신에 따라, 이 스크립트의 작성자는 이를 오픈소스로 공개하여 트레이더들이 기능을 검토하고 검증할 수 있도록 했습니다. 작성자에게 찬사를 보냅니다! 이 코드는 무료로 사용할 수 있지만, 코드를 재게시하는 경우 하우스 룰이 적용된다는 점을 기억하세요.
면책사항
해당 정보와 게시물은 금융, 투자, 트레이딩 또는 기타 유형의 조언이나 권장 사항으로 간주되지 않으며, 트레이딩뷰에서 제공하거나 보증하는 것이 아닙니다. 자세한 내용은 이용 약관을 참조하세요.