OPEN-SOURCE SCRIPT
Momentum RSI | NAL
1. Overview
Momentum RSI | NAL is a momentum-regime indicator built around a Jurik-smoothed double RSI engine. It first smooths price using a Jurik-style moving average, then applies RSI twice to measure both momentum and momentum-of-momentum.
Instead of relying on raw RSI movement, the indicator uses a smoothed second RSI layer to better identify when momentum is expanding or deteriorating. The final Momentum RSI is compared against bullish and bearish thresholds to create a clean directional state.
2. Calculation
The indicator starts by smoothing the selected source with a Jurik-style moving average. This creates a cleaner input before the RSI calculation, helping reduce noise while keeping the response relatively fast.
The first RSI measures the momentum of the smoothed source. The second RSI is then applied to the first RSI, creating a double RSI structure. This second layer measures whether the original RSI itself is strengthening or weakening.
After the double RSI is calculated, it is smoothed again using the same Jurik-style smoothing method. This produces the final Momentum RSI line.
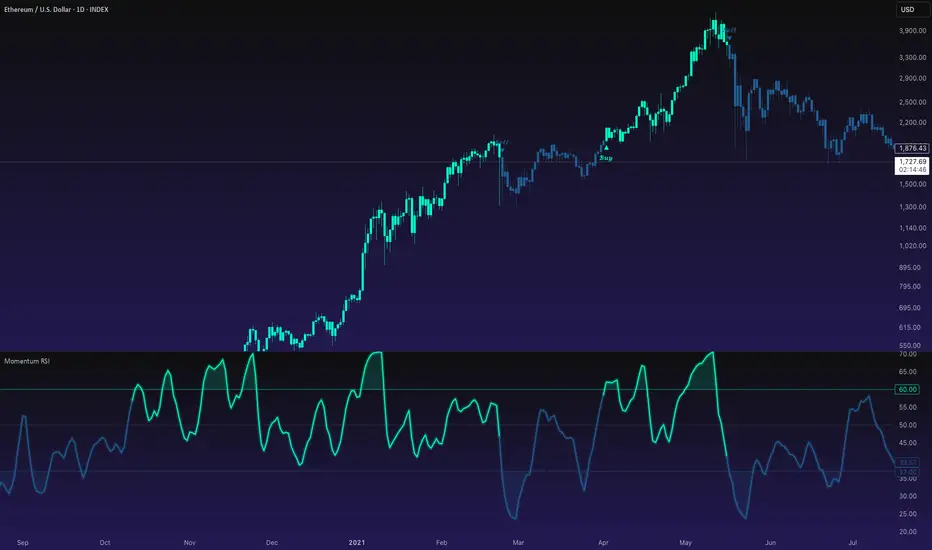
The signal is based on two thresholds. A bullish state triggers when the Momentum RSI rises above the long threshold. A bearish state triggers when the Momentum RSI falls below the short threshold.
When the Momentum RSI is between both thresholds, the indicator keeps its previous directional state. This helps avoid constant neutral flipping and gives a cleaner regime-style output.
3. Key Features
4. Use
Works well for identifying momentum shifts and potential exhaustion areas during trending periods. The double RSI structure can react to changes in momentum before a standard RSI fully confirms the move.
A move above the long threshold suggests bullish momentum pressure. A move below the short threshold suggests bearish momentum pressure. The colored candles and transition labels make it easier to see when the indicator changes state.
Best used in confluence with other indicators, due to its unique behavior and potential for false signals in choppy or low-directional regimes. The indicator is best used as a momentum-regime tool for confirming trend continuation, spotting momentum deterioration, and visually separating bullish and bearish conditions.
Momentum RSI | NAL is a momentum-regime indicator built around a Jurik-smoothed double RSI engine. It first smooths price using a Jurik-style moving average, then applies RSI twice to measure both momentum and momentum-of-momentum.
Instead of relying on raw RSI movement, the indicator uses a smoothed second RSI layer to better identify when momentum is expanding or deteriorating. The final Momentum RSI is compared against bullish and bearish thresholds to create a clean directional state.
2. Calculation
The indicator starts by smoothing the selected source with a Jurik-style moving average. This creates a cleaner input before the RSI calculation, helping reduce noise while keeping the response relatively fast.
The first RSI measures the momentum of the smoothed source. The second RSI is then applied to the first RSI, creating a double RSI structure. This second layer measures whether the original RSI itself is strengthening or weakening.
After the double RSI is calculated, it is smoothed again using the same Jurik-style smoothing method. This produces the final Momentum RSI line.
The signal is based on two thresholds. A bullish state triggers when the Momentum RSI rises above the long threshold. A bearish state triggers when the Momentum RSI falls below the short threshold.
When the Momentum RSI is between both thresholds, the indicator keeps its previous directional state. This helps avoid constant neutral flipping and gives a cleaner regime-style output.
3. Key Features
- Jurik-smoothed double RSI momentum engine.
- Measures both momentum and momentum-of-momentum.
- Bullish and bearish threshold-based regime detection.
- State-based coloring that holds the previous direction between thresholds.
- Glow-style RSI plot, threshold fills, candle coloring, and transition labels.
4. Use
Works well for identifying momentum shifts and potential exhaustion areas during trending periods. The double RSI structure can react to changes in momentum before a standard RSI fully confirms the move.
A move above the long threshold suggests bullish momentum pressure. A move below the short threshold suggests bearish momentum pressure. The colored candles and transition labels make it easier to see when the indicator changes state.
Best used in confluence with other indicators, due to its unique behavior and potential for false signals in choppy or low-directional regimes. The indicator is best used as a momentum-regime tool for confirming trend continuation, spotting momentum deterioration, and visually separating bullish and bearish conditions.
오픈 소스 스크립트
트레이딩뷰의 진정한 정신에 따라, 이 스크립트의 작성자는 이를 오픈소스로 공개하여 트레이더들이 기능을 검토하고 검증할 수 있도록 했습니다. 작성자에게 찬사를 보냅니다! 이 코드는 무료로 사용할 수 있지만, 코드를 재게시하는 경우 하우스 룰이 적용된다는 점을 기억하세요.

🔵 Access our best trading & investing tools, get a 30-day free trial today: whop.com/nordic-alpha-lab/
면책사항
해당 정보와 게시물은 금융, 투자, 트레이딩 또는 기타 유형의 조언이나 권장 사항으로 간주되지 않으며, 트레이딩뷰에서 제공하거나 보증하는 것이 아닙니다. 자세한 내용은 이용 약관을 참조하세요.
오픈 소스 스크립트
트레이딩뷰의 진정한 정신에 따라, 이 스크립트의 작성자는 이를 오픈소스로 공개하여 트레이더들이 기능을 검토하고 검증할 수 있도록 했습니다. 작성자에게 찬사를 보냅니다! 이 코드는 무료로 사용할 수 있지만, 코드를 재게시하는 경우 하우스 룰이 적용된다는 점을 기억하세요.
🔵 Access our best trading & investing tools, get a 30-day free trial today: whop.com/nordic-alpha-lab/
면책사항
해당 정보와 게시물은 금융, 투자, 트레이딩 또는 기타 유형의 조언이나 권장 사항으로 간주되지 않으며, 트레이딩뷰에서 제공하거나 보증하는 것이 아닙니다. 자세한 내용은 이용 약관을 참조하세요.