OPEN-SOURCE SCRIPT
업데이트됨 Market Structure & Liquidity
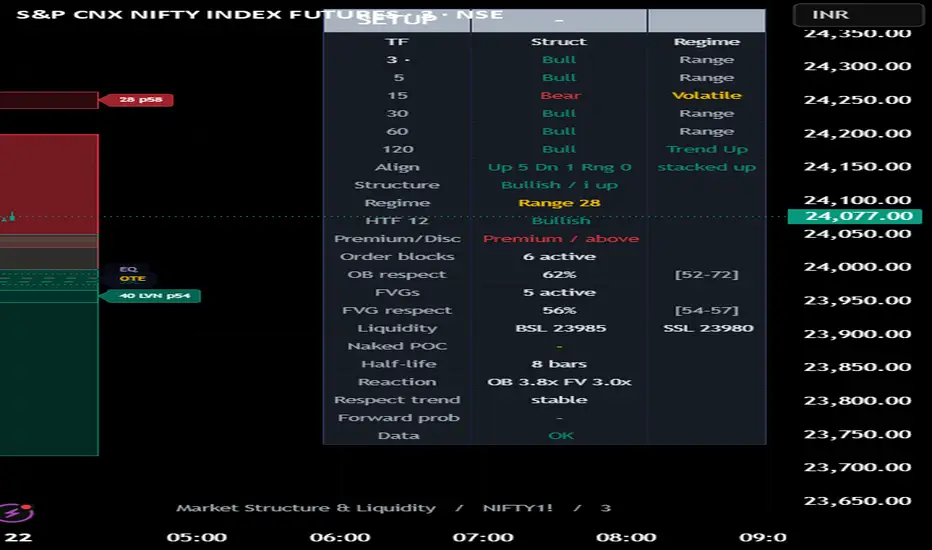
MARKET STRUCTURE & LIQUIDITY — Calibrated Zones, Premium/Discount & Setup Grade
================================================================================
WHAT THIS SCRIPT IS
A single price-action framework that maps the structural read of a chart and
then measures it. It plots market structure (break of structure and change of
character), supply/demand order blocks, fair value gaps, resting liquidity
(equal highs and lows) and the sweeps that take it, premium/discount with an
optimal-entry band, a higher-timeframe bias, and a rolling volume profile. On
top of those objects it does three things most structure tools do not: it
validates every structure break, it scores each zone by confluence and quality,
and it reports — using past data on the current symbol only — how often each
zone type has actually been respected, with statistical confidence intervals.
The levels are the raw material; the framework adds a measured read of which
ones to trust.
WHY THE COMPONENTS ARE COMBINED (how the parts work together)
These are not independent indicators bolted together. They describe one process
— how large participants build positions: rest liquidity, take it, displace
price, and leave an inefficiency behind — and each layer covers a blind spot of
the others, feeding one combined decision:
- Market structure (swing and internal) gives trend context and the moment it
shifts. Because raw break detection is noisy, a break is only counted when it
shows real displacement (range expansion with body, or a volatility
compression followed by a release), closes beyond the level with body rather
than leaving a rejection wick, and breaks a tight, recent (quality) pivot.
This removes most false breaks before anything else is drawn.
- Regime context (efficiency ratio + ADX + volatility clustering + a whipsaw
score) conditions how far to trust a read: continuation breaks are reliable in
a trending regime, reversals are more reliable in a range, and a choppy regime
weights everything down. Structure on its own cannot tell you this.
- Liquidity (equal highs/lows, sweeps, and inducement) marks where stops rest
and the moment they are taken — the trigger that typically precedes a real
move, and the event that validates a nearby zone.
- Order blocks and fair value gaps mark the origin of the displacement and the
inefficiency price tends to revisit. A zone that forms on a sweep, on a
high-volume node, in the correct half of the range scores highest — which is
exactly why liquidity, the volume profile and premium/discount all feed the
zone score rather than living in separate panes.
- Volume profile (point of control, high- and low-volume nodes, and untested
"naked" points of control) tells you whether a zone sits on acceptance (tends
to hold) or on a thin gap (tends to slice), and marks magnet levels price is
drawn back toward.
- Premium/discount and the OTE band frame every zone as expensive or cheap
relative to the current dealing range, so a long in discount and a short in
premium are favoured.
- The confluence engine and setup grade fuse structure direction, a recent
sweep, zone quality, node type, premium/discount alignment, higher-timeframe
bias and a momentum-divergence confirmation into one A/B/C read per zone, so
the chart self-prioritises instead of leaving you to weigh eight things by eye.
- Calibration measures, on past bars only, how often each zone type produced a
meaningful reaction on the current symbol, and reports it with Wilson
confidence intervals — so reliability is earned per instrument, not assumed.
In one sentence: structure says direction, regime says whether to believe it,
liquidity says when, the zones say where, premium/discount says whether it is
worth it, the grade fuses them, and the calibration keeps the whole thing honest.
HOW IT WORKS (mechanics, briefly)
Pivots use the standard left/right confirmation, so structure is non-repainting:
a break is only labelled after the pivot is confirmed and the close validates it.
Order blocks anchor to the last opposing candle before a validated break, are
scored on formation, and are re-scored for confluence on the most recent bar.
Calibration records, the first time a zone is tagged, whether price then travels
a chosen ATR multiple in the zone's direction within a fixed horizon, and
aggregates that into the respect rate shown on the dashboard. All thresholds are
ATR-relative, so nothing is tied to a particular price scale.
HOW TO USE IT
1. Read the dashboard headline: the SETUP grade and the structure bias.
2. Favour higher-grade setups — a validated structure direction, a recent sweep,
a fresh high-quality zone sitting on a volume node, in discount for longs or
premium for shorts, with higher-timeframe agreement.
3. Use the OTE band for entry context and an opposing fair value gap as a
logical target.
4. Check the respect rows. If order blocks or fair value gaps rarely hold on this
symbol, weight the read down accordingly.
5. Treat everything as descriptive context, not a signal to act on.
USE ON ANY MARKET
The High / Low / Close source inputs let you drive structure, liquidity and
premium/discount from any series (standard candles, Heikin-Ashi, or another
source), so the framework applies to stocks, indices, futures, forex and crypto.
A volume-borrow input supplies volume for symbols that report none.
WHAT MAKES IT ORIGINAL
The contribution is the closed loop, not the individual objects, which are
common to price-action analysis. Here, validated structure and liquidity feed a
per-zone confluence and quality score and a single setup grade, and a past-only
calibration tracker reports each zone type's actual respect rate on the current
symbol with confidence intervals. That turns a set of drawing tools into a
measured, self-prioritising read.
SETTINGS WORTH KNOWING
- Break Validation: turn displacement, anti-wick and pivot-quality gates on/off
and tune their strictness to make structure more or less selective.
- Volume Profile / Nodes: bins, window and HVN/LVN percentiles control node
tagging; naked POC tracking is session-based and turns itself off when the
chart is not intraday.
- Confluence & Setup Grade: cluster tolerance controls how close levels must be
to count as confluent.
- Calibration: horizon and minimum reaction define what counts as a "respected"
zone.
- Visuals: theme is auto/dark/light; grade-weighted opacity makes strong zones
bold and weak ones faint; the identity strip shows the script name, symbol and
timeframe.
LIMITATIONS
Pivots confirm after the right-bars lag, so forming structure is not drawn until
confirmed. Volume layers require real or borrowed volume. Calibration describes
past behaviour only — it is not a backtest and not a probability of future
results. Every read is probabilistic context, never a certainty.
DISCLAIMER
This is a study/indicator for chart analysis and education only. It is not a
strategy, not a recommendation, and not financial advice. It places no orders
and guarantees no outcome. Markets carry risk, and the past behaviour of a level
does not assure its future behaviour. Do your own research and manage your own
risk.
================================================================================
WHAT THIS SCRIPT IS
A single price-action framework that maps the structural read of a chart and
then measures it. It plots market structure (break of structure and change of
character), supply/demand order blocks, fair value gaps, resting liquidity
(equal highs and lows) and the sweeps that take it, premium/discount with an
optimal-entry band, a higher-timeframe bias, and a rolling volume profile. On
top of those objects it does three things most structure tools do not: it
validates every structure break, it scores each zone by confluence and quality,
and it reports — using past data on the current symbol only — how often each
zone type has actually been respected, with statistical confidence intervals.
The levels are the raw material; the framework adds a measured read of which
ones to trust.
WHY THE COMPONENTS ARE COMBINED (how the parts work together)
These are not independent indicators bolted together. They describe one process
— how large participants build positions: rest liquidity, take it, displace
price, and leave an inefficiency behind — and each layer covers a blind spot of
the others, feeding one combined decision:
- Market structure (swing and internal) gives trend context and the moment it
shifts. Because raw break detection is noisy, a break is only counted when it
shows real displacement (range expansion with body, or a volatility
compression followed by a release), closes beyond the level with body rather
than leaving a rejection wick, and breaks a tight, recent (quality) pivot.
This removes most false breaks before anything else is drawn.
- Regime context (efficiency ratio + ADX + volatility clustering + a whipsaw
score) conditions how far to trust a read: continuation breaks are reliable in
a trending regime, reversals are more reliable in a range, and a choppy regime
weights everything down. Structure on its own cannot tell you this.
- Liquidity (equal highs/lows, sweeps, and inducement) marks where stops rest
and the moment they are taken — the trigger that typically precedes a real
move, and the event that validates a nearby zone.
- Order blocks and fair value gaps mark the origin of the displacement and the
inefficiency price tends to revisit. A zone that forms on a sweep, on a
high-volume node, in the correct half of the range scores highest — which is
exactly why liquidity, the volume profile and premium/discount all feed the
zone score rather than living in separate panes.
- Volume profile (point of control, high- and low-volume nodes, and untested
"naked" points of control) tells you whether a zone sits on acceptance (tends
to hold) or on a thin gap (tends to slice), and marks magnet levels price is
drawn back toward.
- Premium/discount and the OTE band frame every zone as expensive or cheap
relative to the current dealing range, so a long in discount and a short in
premium are favoured.
- The confluence engine and setup grade fuse structure direction, a recent
sweep, zone quality, node type, premium/discount alignment, higher-timeframe
bias and a momentum-divergence confirmation into one A/B/C read per zone, so
the chart self-prioritises instead of leaving you to weigh eight things by eye.
- Calibration measures, on past bars only, how often each zone type produced a
meaningful reaction on the current symbol, and reports it with Wilson
confidence intervals — so reliability is earned per instrument, not assumed.
In one sentence: structure says direction, regime says whether to believe it,
liquidity says when, the zones say where, premium/discount says whether it is
worth it, the grade fuses them, and the calibration keeps the whole thing honest.
HOW IT WORKS (mechanics, briefly)
Pivots use the standard left/right confirmation, so structure is non-repainting:
a break is only labelled after the pivot is confirmed and the close validates it.
Order blocks anchor to the last opposing candle before a validated break, are
scored on formation, and are re-scored for confluence on the most recent bar.
Calibration records, the first time a zone is tagged, whether price then travels
a chosen ATR multiple in the zone's direction within a fixed horizon, and
aggregates that into the respect rate shown on the dashboard. All thresholds are
ATR-relative, so nothing is tied to a particular price scale.
HOW TO USE IT
1. Read the dashboard headline: the SETUP grade and the structure bias.
2. Favour higher-grade setups — a validated structure direction, a recent sweep,
a fresh high-quality zone sitting on a volume node, in discount for longs or
premium for shorts, with higher-timeframe agreement.
3. Use the OTE band for entry context and an opposing fair value gap as a
logical target.
4. Check the respect rows. If order blocks or fair value gaps rarely hold on this
symbol, weight the read down accordingly.
5. Treat everything as descriptive context, not a signal to act on.
USE ON ANY MARKET
The High / Low / Close source inputs let you drive structure, liquidity and
premium/discount from any series (standard candles, Heikin-Ashi, or another
source), so the framework applies to stocks, indices, futures, forex and crypto.
A volume-borrow input supplies volume for symbols that report none.
WHAT MAKES IT ORIGINAL
The contribution is the closed loop, not the individual objects, which are
common to price-action analysis. Here, validated structure and liquidity feed a
per-zone confluence and quality score and a single setup grade, and a past-only
calibration tracker reports each zone type's actual respect rate on the current
symbol with confidence intervals. That turns a set of drawing tools into a
measured, self-prioritising read.
SETTINGS WORTH KNOWING
- Break Validation: turn displacement, anti-wick and pivot-quality gates on/off
and tune their strictness to make structure more or less selective.
- Volume Profile / Nodes: bins, window and HVN/LVN percentiles control node
tagging; naked POC tracking is session-based and turns itself off when the
chart is not intraday.
- Confluence & Setup Grade: cluster tolerance controls how close levels must be
to count as confluent.
- Calibration: horizon and minimum reaction define what counts as a "respected"
zone.
- Visuals: theme is auto/dark/light; grade-weighted opacity makes strong zones
bold and weak ones faint; the identity strip shows the script name, symbol and
timeframe.
LIMITATIONS
Pivots confirm after the right-bars lag, so forming structure is not drawn until
confirmed. Volume layers require real or borrowed volume. Calibration describes
past behaviour only — it is not a backtest and not a probability of future
results. Every read is probabilistic context, never a certainty.
DISCLAIMER
This is a study/indicator for chart analysis and education only. It is not a
strategy, not a recommendation, and not financial advice. It places no orders
and guarantees no outcome. Markets carry risk, and the past behaviour of a level
does not assure its future behaviour. Do your own research and manage your own
risk.
릴리즈 노트
MS Liquidity — Update noteWhat's new
This update makes the calibration forward-looking and multi-timeframe, adds a reference Trade Map, and merges everything into one adaptive Compact/Pro dashboard.
Forward probability — each resolved zone banks the context it was tested in (quality, structure, regime, efficiency, volume) and whether it held; a new zone is scored by a distance-weighted vote over past zones in similar context, shown as "p__".
Reaction strength — average favourable travel (ATR) after a zone is tagged: how hard it reacted, alongside whether it held.
Protected-swing CHoCH — a change of character only counts when the swing that launched the prior leg breaks, cutting flip-flop on shallow pullbacks.
Self-calibrating displacement & OTE — break threshold and optimal-entry band derive from the instrument's own recent displacement and retracement distributions instead of fixed numbers.
Zone lifecycle — overlapping same-side blocks merge; the cap prunes the weakest, not the oldest; stale zones decay in rank and opacity.
Respect-trend — recent respect vs all-history, with a runs-test streak flag.
Trade Map — for the top setup, reference entry / invalidation / target ladder (next opposing liquidity) with the R-multiple. Reference levels, not a signal.
Unified MTF dashboard — one adaptive table: setup decision + structure/regime across the chart timeframe and the next standard higher resolutions (non-repainting), plus a bias-agreement line. Compact (default) or Pro detail; colours adapt to the chart background.
Why these belong together
One process — rest liquidity, take it, displace, leave an inefficiency. Structure says direction; regime says whether to believe it; liquidity says when; order blocks and fair-value gaps say where; volume profile and premium/discount say whether a zone is worth trusting; the grade fuses them; the Trade Map expresses the best one; calibration measures, per-symbol and past-only, how often each zone type actually holds; and the multi-timeframe panel frames it top-down. Each layer covers a blind spot of the others and feeds one decision.
How to use
Read the headline grade, direction and forward probability; check the multi-timeframe agreement; favour a validated structure break + recent sweep + fresh high-quality zone in the right half of the range with higher-timeframe agreement; use the Trade Map's stop as structural invalidation and its targets as the next liquidity; and weight everything less when the respect rate is low or its trend is decaying.
Use on any market
High/Low/Close source inputs and a volume-borrow input drive it on any instrument; all thresholds are ATR-relative. Defaults are tuned for NIFTY index futures — adjust swing length and thresholds for other assets.
Originality
The contribution is the closed loop, not the objects: validated structure and liquidity feed a per-zone score and a unified grade; a past-only tracker reports each zone type's real respect rate with confidence intervals; a forward analogue estimate scores new zones by resemblance to past ones; and a single adaptive multi-timeframe dashboard frames it all.
Limitations
Pivots confirm after the right-bars lag. Volume layers need real (or borrowed) volume. Calibration and forward probability describe past behaviour only — not a backtest, not a guarantee — and degrade on small samples or regime shifts. The Trade Map is reference geometry, not an order. All output is probabilistic context, not advice.
Concept credits
Efficiency ratio (Kaufman); proportion score interval (Wilson); runs test (Wald & Wolfowitz); mean-reversion half-life (Ornstein-Uhlenbeck); distance-weighted analogue classification from the open-source community. No third-party scripts reused; implementation original.
Disclaimer
Indicator for analysis and education only — not a strategy, recommendation or financial advice. It places no orders and guarantees no outcome. Markets carry risk; a level's past behaviour does not assure its future behaviour. Do your own research and manage your own risk.
오픈 소스 스크립트
트레이딩뷰의 진정한 정신에 따라, 이 스크립트의 작성자는 이를 오픈소스로 공개하여 트레이더들이 기능을 검토하고 검증할 수 있도록 했습니다. 작성자에게 찬사를 보냅니다! 이 코드는 무료로 사용할 수 있지만, 코드를 재게시하는 경우 하우스 룰이 적용된다는 점을 기억하세요.

면책사항
해당 정보와 게시물은 금융, 투자, 트레이딩 또는 기타 유형의 조언이나 권장 사항으로 간주되지 않으며, 트레이딩뷰에서 제공하거나 보증하는 것이 아닙니다. 자세한 내용은 이용 약관을 참조하세요.
오픈 소스 스크립트
트레이딩뷰의 진정한 정신에 따라, 이 스크립트의 작성자는 이를 오픈소스로 공개하여 트레이더들이 기능을 검토하고 검증할 수 있도록 했습니다. 작성자에게 찬사를 보냅니다! 이 코드는 무료로 사용할 수 있지만, 코드를 재게시하는 경우 하우스 룰이 적용된다는 점을 기억하세요.
면책사항
해당 정보와 게시물은 금융, 투자, 트레이딩 또는 기타 유형의 조언이나 권장 사항으로 간주되지 않으며, 트레이딩뷰에서 제공하거나 보증하는 것이 아닙니다. 자세한 내용은 이용 약관을 참조하세요.