OPEN-SOURCE SCRIPT
options
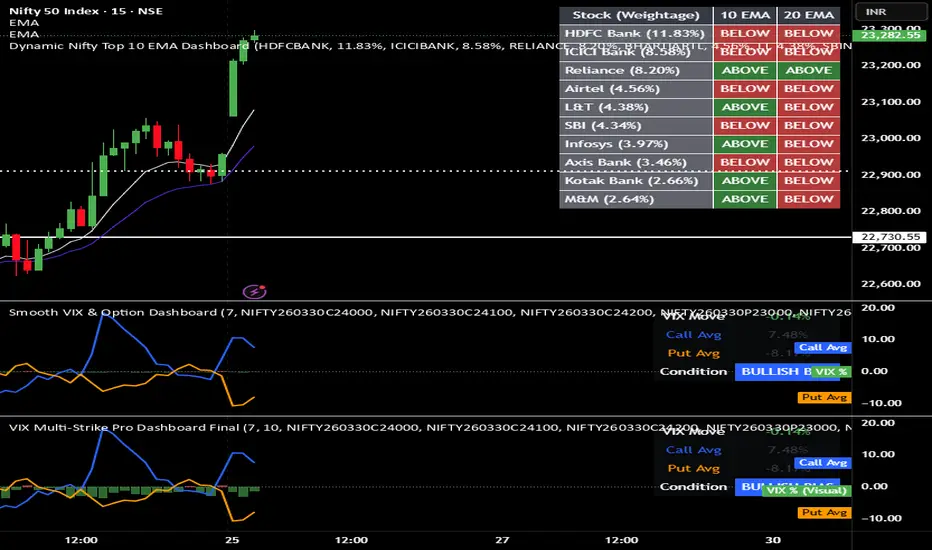
These Red and Green Bars are actually showing the status of the India VIX (Market Fear Index). Their movement up and down tells you whether "Fear" is increasing or decreasing in the market.
In simple terms, here is what they mean:
1. Red Bars (VIX is Up 📈)
* What is happening: This means the India VIX has moved higher compared to the previous candle.
* Psychology: Uncertainty or fear is rising in the market.
* Impact: When these bars are large and Red, the premiums of both Calls and Puts start to rise.
* For Sellers: This is dangerous because the options you sold are becoming more expensive (Inflating).
2. Green Bars (VIX is Down 📉)
* What is happening: This means the India VIX is falling.
* Psychology: The market is cooling down; traders are no longer feeling as much fear.
* Impact: This causes a "Vega Crush." Premiums shrink (decay) rapidly.
* For Sellers: This is "Jackpot" time. You make money from both theta decay and the drop in volatility.
Relationship Between Bars and Lines (Blue/Orange):
You simply need to look for these combinations:
* Large Red Bars + Blue/Orange Lines Up: This is a "Volatility Spike." Regardless of the direction, premiums are inflating. The chance of hitting a stop-loss is higher.
* Large Green Bars + Blue/Orange Lines Down: This is a "Vega Crush." This is the best setup for 0.3 delta selling. Even if the market stays sideways, premiums will crash toward zero quickly.
Summary Table:
| Bar Color | VIX Status | Market Mood | Option Seller (You) |
|---|---|---|---|
| RED (High) | Up | Panic/Fear | Risk: Premiums will spike. |
| GREEN (High) | Down | Relaxed | Profit: Premiums will drop fast. |
| Small Bars | Flat | Stable | Normal: You get standard Theta decay. |
In simple terms, here is what they mean:
1. Red Bars (VIX is Up 📈)
* What is happening: This means the India VIX has moved higher compared to the previous candle.
* Psychology: Uncertainty or fear is rising in the market.
* Impact: When these bars are large and Red, the premiums of both Calls and Puts start to rise.
* For Sellers: This is dangerous because the options you sold are becoming more expensive (Inflating).
2. Green Bars (VIX is Down 📉)
* What is happening: This means the India VIX is falling.
* Psychology: The market is cooling down; traders are no longer feeling as much fear.
* Impact: This causes a "Vega Crush." Premiums shrink (decay) rapidly.
* For Sellers: This is "Jackpot" time. You make money from both theta decay and the drop in volatility.
Relationship Between Bars and Lines (Blue/Orange):
You simply need to look for these combinations:
* Large Red Bars + Blue/Orange Lines Up: This is a "Volatility Spike." Regardless of the direction, premiums are inflating. The chance of hitting a stop-loss is higher.
* Large Green Bars + Blue/Orange Lines Down: This is a "Vega Crush." This is the best setup for 0.3 delta selling. Even if the market stays sideways, premiums will crash toward zero quickly.
Summary Table:
| Bar Color | VIX Status | Market Mood | Option Seller (You) |
|---|---|---|---|
| RED (High) | Up | Panic/Fear | Risk: Premiums will spike. |
| GREEN (High) | Down | Relaxed | Profit: Premiums will drop fast. |
| Small Bars | Flat | Stable | Normal: You get standard Theta decay. |
오픈 소스 스크립트
트레이딩뷰의 진정한 정신에 따라, 이 스크립트의 작성자는 이를 오픈소스로 공개하여 트레이더들이 기능을 검토하고 검증할 수 있도록 했습니다. 작성자에게 찬사를 보냅니다! 이 코드는 무료로 사용할 수 있지만, 코드를 재게시하는 경우 하우스 룰이 적용된다는 점을 기억하세요.

면책사항
해당 정보와 게시물은 금융, 투자, 트레이딩 또는 기타 유형의 조언이나 권장 사항으로 간주되지 않으며, 트레이딩뷰에서 제공하거나 보증하는 것이 아닙니다. 자세한 내용은 이용 약관을 참조하세요.
오픈 소스 스크립트
트레이딩뷰의 진정한 정신에 따라, 이 스크립트의 작성자는 이를 오픈소스로 공개하여 트레이더들이 기능을 검토하고 검증할 수 있도록 했습니다. 작성자에게 찬사를 보냅니다! 이 코드는 무료로 사용할 수 있지만, 코드를 재게시하는 경우 하우스 룰이 적용된다는 점을 기억하세요.
면책사항
해당 정보와 게시물은 금융, 투자, 트레이딩 또는 기타 유형의 조언이나 권장 사항으로 간주되지 않으며, 트레이딩뷰에서 제공하거나 보증하는 것이 아닙니다. 자세한 내용은 이용 약관을 참조하세요.