업데이트됨
Quantitative Monthly Seasonality Dashboard V2
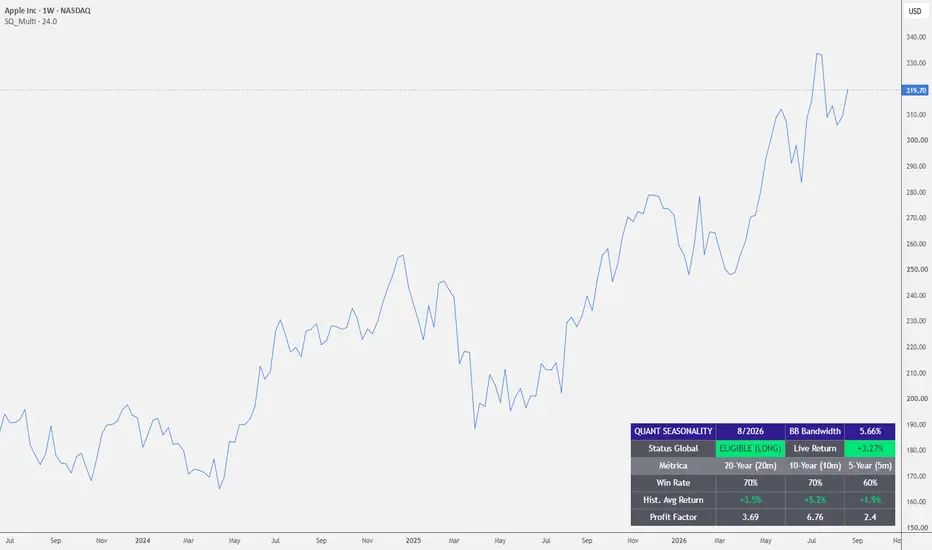
Sadashi Quant Seasonality V2 is a quantitative tool designed to evaluate the seasonal probability of any financial asset for the current calendar month, integrating volatility metrics and risk-adjusted performance data.
Unlike standard seasonal indicators, V2 evaluates both directional probability and trend quality using Bollinger Bandwidth compression filters and Profit Factor scoring, ensuring trades meet favorable risk-to-reward standards.
Key Dashboard Metrics:
Historical Win Rate: Percentage of years the asset closed positive during the current month across 20-year, 10-year, and 5-year lookback periods.
Profit Factor (PF): Ratio of total gross profits to total gross losses for the month. A PF > 1.0 confirms positive statistical asymmetry.
Hist. Avg Return: Expected average performance for the current month.
BB Bandwidth Filter: Volatility expansion/compression metric to filter out low-momentum market environments.
Global Status: Real-time trade signal (LONG / SHORT / NO TRADE) based on quantitative eligibility thresholds.
Trading Logic:
A 50% or 60% Win Rate can yield a Profit Factor of 1.5x to 2.0x if the average winning month significantly outweighs average losses, helping traders spot high-expectancy setups regardless of raw win frequency.
Developed for the Sadashi Trading community.
Unlike standard seasonal indicators, V2 evaluates both directional probability and trend quality using Bollinger Bandwidth compression filters and Profit Factor scoring, ensuring trades meet favorable risk-to-reward standards.
Key Dashboard Metrics:
Historical Win Rate: Percentage of years the asset closed positive during the current month across 20-year, 10-year, and 5-year lookback periods.
Profit Factor (PF): Ratio of total gross profits to total gross losses for the month. A PF > 1.0 confirms positive statistical asymmetry.
Hist. Avg Return: Expected average performance for the current month.
BB Bandwidth Filter: Volatility expansion/compression metric to filter out low-momentum market environments.
Global Status: Real-time trade signal (LONG / SHORT / NO TRADE) based on quantitative eligibility thresholds.
Trading Logic:
A 50% or 60% Win Rate can yield a Profit Factor of 1.5x to 2.0x if the average winning month significantly outweighs average losses, helping traders spot high-expectancy setups regardless of raw win frequency.
Developed for the Sadashi Trading community.
릴리즈 노트
Fix to monthly Live Return calculation and data capture optimization
면책사항
해당 정보와 게시물은 금융, 투자, 트레이딩 또는 기타 유형의 조언이나 권장 사항으로 간주되지 않으며, 트레이딩뷰에서 제공하거나 보증하는 것이 아닙니다. 자세한 내용은 이용 약관을 참조하세요.
면책사항
해당 정보와 게시물은 금융, 투자, 트레이딩 또는 기타 유형의 조언이나 권장 사항으로 간주되지 않으며, 트레이딩뷰에서 제공하거나 보증하는 것이 아닙니다. 자세한 내용은 이용 약관을 참조하세요.