OPEN-SOURCE SCRIPT
업데이트됨 MoonBoys Line
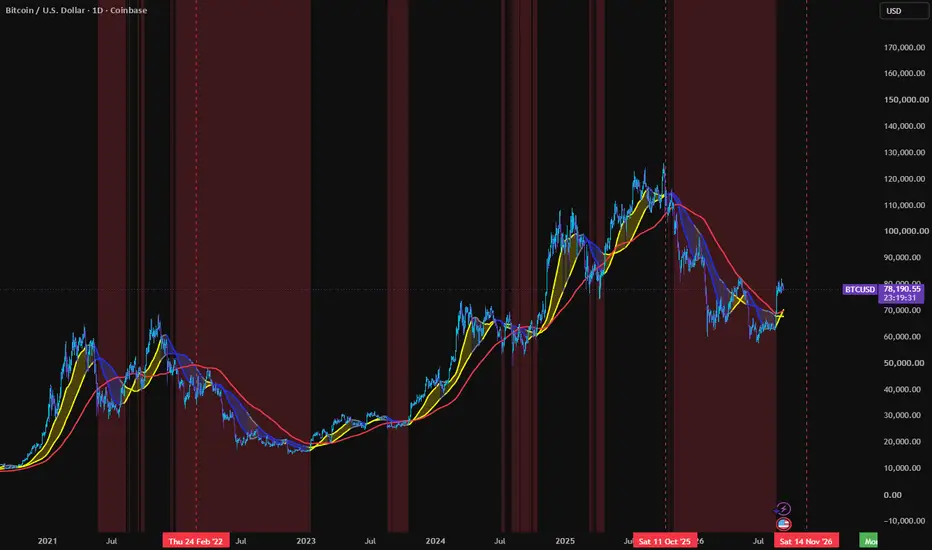
MoonBoys Line – Market Regime & Trend Confirmation Indicator
The MoonBoys Line is a simple but powerful trend-following system designed to identify bullish and bearish market regimes using key daily moving averages.
Built around the 44, 125, and 200-day SMAs, this indicator helps you quickly determine trend direction, strength, and key areas of support/resistance.
🔍 How It Works
44 SMA (Fast Line) → Short-term trend
125 SMA (Slow Line) → Mid-term trend (key reclaim level)
200 SMA (Red Line) → Macro trend / “fair value” baseline
🟡 Bullish Regime
Price is above both the 44 & 125 SMAs
Lines turn yellow
Band turns gold
Indicates strong upward momentum and trend continuation
🔵 Bearish Regime
Price is below both the 44 & 125 SMAs
Lines turn blue
Band turns blue
Signals downside momentum and potential continuation lower
⚪ Neutral / Chop
Price is between the 44 and 125
Lines turn gray
Indicates uncertainty or consolidation
🔴 Risk Zone (200 SMA)
When price falls below the 200 SMA, the background turns red
This highlights high-risk conditions and potential macro weakness
🧠 How We Use It (Moon Boys Strategy)
Reclaim of 125 SMA = early signal of bullish reversal
Holding above 44 SMA = trend strength confirmation
Losing 125 SMA = caution / trend weakening
Below 200 SMA = risk-off environment
This indicator is designed to keep you on the right side of the trend and avoid getting chopped up in uncertain markets.
The MoonBoys Line is a simple but powerful trend-following system designed to identify bullish and bearish market regimes using key daily moving averages.
Built around the 44, 125, and 200-day SMAs, this indicator helps you quickly determine trend direction, strength, and key areas of support/resistance.
🔍 How It Works
44 SMA (Fast Line) → Short-term trend
125 SMA (Slow Line) → Mid-term trend (key reclaim level)
200 SMA (Red Line) → Macro trend / “fair value” baseline
🟡 Bullish Regime
Price is above both the 44 & 125 SMAs
Lines turn yellow
Band turns gold
Indicates strong upward momentum and trend continuation
🔵 Bearish Regime
Price is below both the 44 & 125 SMAs
Lines turn blue
Band turns blue
Signals downside momentum and potential continuation lower
⚪ Neutral / Chop
Price is between the 44 and 125
Lines turn gray
Indicates uncertainty or consolidation
🔴 Risk Zone (200 SMA)
When price falls below the 200 SMA, the background turns red
This highlights high-risk conditions and potential macro weakness
🧠 How We Use It (Moon Boys Strategy)
Reclaim of 125 SMA = early signal of bullish reversal
Holding above 44 SMA = trend strength confirmation
Losing 125 SMA = caution / trend weakening
Below 200 SMA = risk-off environment
This indicator is designed to keep you on the right side of the trend and avoid getting chopped up in uncertain markets.
릴리즈 노트
Optimizing the moving averaged:44 becomes 50
125 becomes 116
As per Gerhard, 116 is more profitable for bitcoin than 125. 50 is for trading perps, 116 is for trading spot.
오픈 소스 스크립트
트레이딩뷰의 진정한 정신에 따라, 이 스크립트의 작성자는 이를 오픈소스로 공개하여 트레이더들이 기능을 검토하고 검증할 수 있도록 했습니다. 작성자에게 찬사를 보냅니다! 이 코드는 무료로 사용할 수 있지만, 코드를 재게시하는 경우 하우스 룰이 적용된다는 점을 기억하세요.

Not Financial Advice
면책사항
해당 정보와 게시물은 금융, 투자, 트레이딩 또는 기타 유형의 조언이나 권장 사항으로 간주되지 않으며, 트레이딩뷰에서 제공하거나 보증하는 것이 아닙니다. 자세한 내용은 이용 약관을 참조하세요.
오픈 소스 스크립트
트레이딩뷰의 진정한 정신에 따라, 이 스크립트의 작성자는 이를 오픈소스로 공개하여 트레이더들이 기능을 검토하고 검증할 수 있도록 했습니다. 작성자에게 찬사를 보냅니다! 이 코드는 무료로 사용할 수 있지만, 코드를 재게시하는 경우 하우스 룰이 적용된다는 점을 기억하세요.
Not Financial Advice
면책사항
해당 정보와 게시물은 금융, 투자, 트레이딩 또는 기타 유형의 조언이나 권장 사항으로 간주되지 않으며, 트레이딩뷰에서 제공하거나 보증하는 것이 아닙니다. 자세한 내용은 이용 약관을 참조하세요.