OPEN-SOURCE SCRIPT
업데이트됨 P12 Session Levels
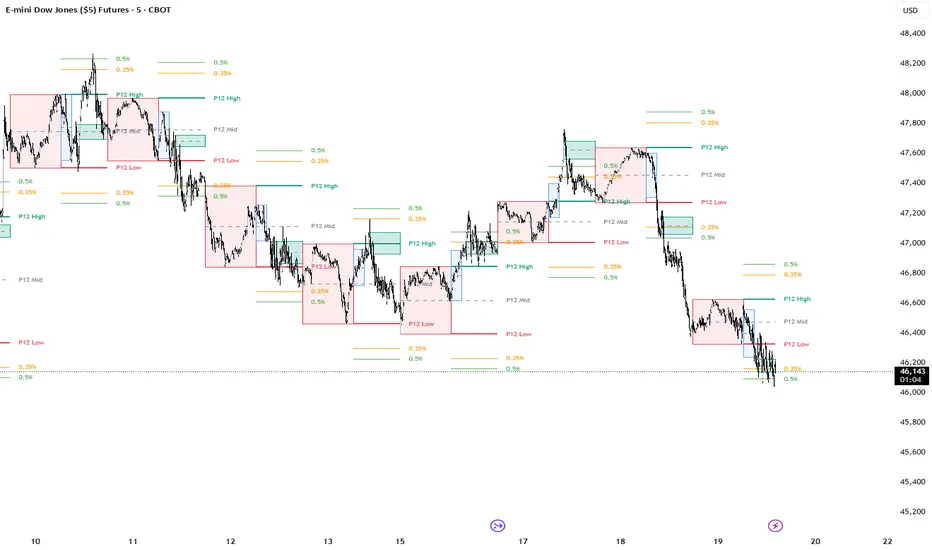
P12 – Previous 12 Hour Range
The P12 (Previous 12 Hour Range) indicator visualizes the high and low of the prior 12-hour period to provide a clear reference for current session context. The previous range can often act as a structural boundary where price may react, consolidate, or expand beyond as new liquidity enters the market.
By highlighting the prior 12-hour range directly on the chart, traders can quickly identify areas where price is interacting with recent market structure. Breaks, rejections, or rotations around this range can provide useful context for intraday analysis.
This concept is similar to approaches that study how price behaves relative to prior session ranges. Tools such as The Daily Profiler analyze historical session behavior to identify when highs and lows tend to occur. The P12 range provides a simple structural reference that traders can use alongside statistical timing studies, volume profile levels, or other forms of market structure analysis.
Features
Displays the high and low of the previous 12-hour range
Updates automatically as new sessions form
Helps visualize recent structural boundaries in the market
Can be combined with other analytical tools for context
This indicator is intended as a visual reference tool for studying market structure and range behavior and should be used alongside a trader’s existing analysis methods.
I personally use these extension levels with YM, you can find your own that work with you.
The P12 (Previous 12 Hour Range) indicator visualizes the high and low of the prior 12-hour period to provide a clear reference for current session context. The previous range can often act as a structural boundary where price may react, consolidate, or expand beyond as new liquidity enters the market.
By highlighting the prior 12-hour range directly on the chart, traders can quickly identify areas where price is interacting with recent market structure. Breaks, rejections, or rotations around this range can provide useful context for intraday analysis.
This concept is similar to approaches that study how price behaves relative to prior session ranges. Tools such as The Daily Profiler analyze historical session behavior to identify when highs and lows tend to occur. The P12 range provides a simple structural reference that traders can use alongside statistical timing studies, volume profile levels, or other forms of market structure analysis.
Features
Displays the high and low of the previous 12-hour range
Updates automatically as new sessions form
Helps visualize recent structural boundaries in the market
Can be combined with other analytical tools for context
This indicator is intended as a visual reference tool for studying market structure and range behavior and should be used alongside a trader’s existing analysis methods.
I personally use these extension levels with YM, you can find your own that work with you.
릴리즈 노트
Updated extensions to change to user settings.Added 0600-0830 range and 930 opening range.
릴리즈 노트
***오픈 소스 스크립트
트레이딩뷰의 진정한 정신에 따라, 이 스크립트의 작성자는 이를 오픈소스로 공개하여 트레이더들이 기능을 검토하고 검증할 수 있도록 했습니다. 작성자에게 찬사를 보냅니다! 이 코드는 무료로 사용할 수 있지만, 코드를 재게시하는 경우 하우스 룰이 적용된다는 점을 기억하세요.

면책사항
해당 정보와 게시물은 금융, 투자, 트레이딩 또는 기타 유형의 조언이나 권장 사항으로 간주되지 않으며, 트레이딩뷰에서 제공하거나 보증하는 것이 아닙니다. 자세한 내용은 이용 약관을 참조하세요.
오픈 소스 스크립트
트레이딩뷰의 진정한 정신에 따라, 이 스크립트의 작성자는 이를 오픈소스로 공개하여 트레이더들이 기능을 검토하고 검증할 수 있도록 했습니다. 작성자에게 찬사를 보냅니다! 이 코드는 무료로 사용할 수 있지만, 코드를 재게시하는 경우 하우스 룰이 적용된다는 점을 기억하세요.
면책사항
해당 정보와 게시물은 금융, 투자, 트레이딩 또는 기타 유형의 조언이나 권장 사항으로 간주되지 않으며, 트레이딩뷰에서 제공하거나 보증하는 것이 아닙니다. 자세한 내용은 이용 약관을 참조하세요.