OPEN-SOURCE SCRIPT
AlgoYields - A
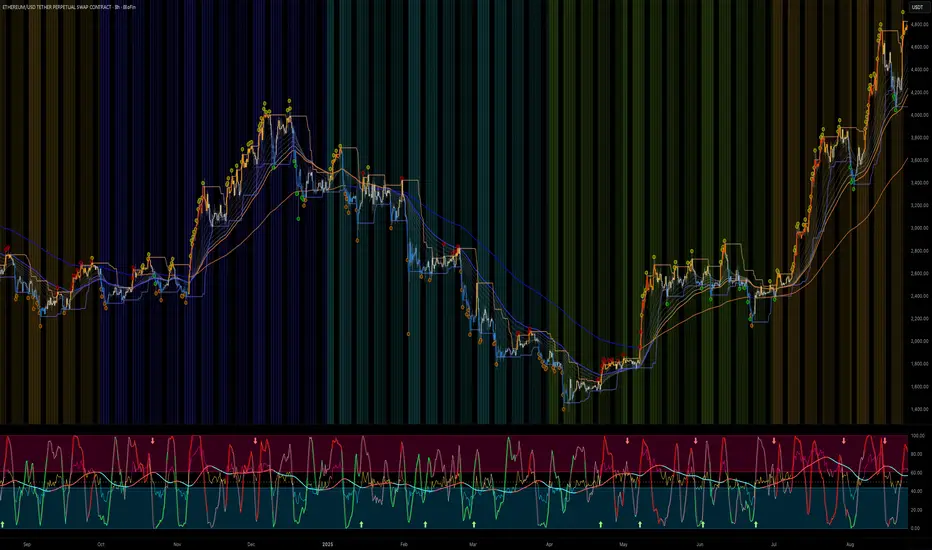
AlgoYields A — Everyday Overlay for Clean, Actionable Context
Please follow — more indicators & ideas coming soon!
Equipped with alerts and customizable styles, this overlay is designed for daily use: attractive look for fast reads, low noise, high signal. It blends a few trusted tools into a single, elegant view so you can track trend, momentum, and breakouts without overcrowding.
What’s inside
How to use it
––––––––––
Bullish Breakdowns ([color=#15b700]green[/color] dots) — often attractive dip-buys within uptrends.
Confirm with macro-EMA slope: steeper = stronger follow-through; flatting slope = take quicker profits and watch for potential rollover.

Bullish Breakouts ([color=#b7b100]yellow[/color] dots) — be selective. If RSI confirms strength, these can be solid for quick scalps; otherwise, beware “touch-and-fade” at the upper band.

Apply the same logic in reverse for shorts:
Bearish Breakouts ([color=#b50000]red[/color]) and Bearish Breakdowns ([color=#b56700]orange[/color]) favor short entries/continuations.

Inputs worth tweaking
Alerts
Choose from built-in signals (channel breaks, EMA crosses, significant RSI levels).
Notes & best practices
Please follow — more indicators & ideas coming soon!
Equipped with alerts and customizable styles, this overlay is designed for daily use: attractive look for fast reads, low noise, high signal. It blends a few trusted tools into a single, elegant view so you can track trend, momentum, and breakouts without overcrowding.
What’s inside
- Trading Session Backdrop
Quarter-tinted background (distinct color per quarter) for quick macro orientation; subtle week-to-week transparency shifts; CME pre-market, regular session, and post-market shading; weekends left clear.
Includes multiple curated color palettes. Ask if you want a custom theme. - EMA Cloud
A staircase of short EMAs for trend strength + two macro EMAs (defaults: 80 & 200). Macro EMAs auto-tint: blue when price is above, orange when below.
All lengths are user-configurable. - RSI-Derived Bar Colors
Contextual bar coloring by RSI level/zone to make strength/weakness instantly visible.
Comes with multiple palettes optimized for light/dark charts.
[]Price Channel & Breakouts
Select band source: Close (tight), HLC3 (medium), or High/Low (widest). Breakout dots print above/below bars and are color-coded by trend context:
[][color=#15b700]Green[/color]: break below lower band in an uptrend (buy-the-dip candidates).
[][color=#b7b100]Yellow[/color]: break above upper band in an uptrend (potential exhaustion / quick scalp).
[][color=#b56700]Orange[/color]: break below lower band in a downtrend (continuation shorts).- [color=#b50000]Red[/color]: break above upper band in a downtrend (fade-the-pop entries).
Buffer values can be tuned to reduce noise or enhance reactivity
How to use it
––––––––––
Bullish Breakdowns ([color=#15b700]green[/color] dots) — often attractive dip-buys within uptrends.
Confirm with macro-EMA slope: steeper = stronger follow-through; flatting slope = take quicker profits and watch for potential rollover.
Bullish Breakouts ([color=#b7b100]yellow[/color] dots) — be selective. If RSI confirms strength, these can be solid for quick scalps; otherwise, beware “touch-and-fade” at the upper band.
Apply the same logic in reverse for shorts:
Bearish Breakouts ([color=#b50000]red[/color]) and Bearish Breakdowns ([color=#b56700]orange[/color]) favor short entries/continuations.
Inputs worth tweaking
[]EMA lengths (short stack + macro 80/200 defaults).
[]RSI bar-color palette (pick for light/dark themes).
[]Channel source (Close / HLC3 / High-Low) and breakout buffer.
[]Session/quarter palette selection.
Alerts
Choose from built-in signals (channel breaks, EMA crosses, significant RSI levels).
Notes & best practices
[]Backtest breakouts per asset/timeframe to tune buffers and TP/SL targets.
[]Use level + slope together: RSI/EMA levels flag conditions; slope confirms impulse/continuation.- Let the EMA cloud and macro EMAs set bias; use RSI bars and breakout dots for timing.
오픈 소스 스크립트
트레이딩뷰의 진정한 정신에 따라, 이 스크립트의 작성자는 이를 오픈소스로 공개하여 트레이더들이 기능을 검토하고 검증할 수 있도록 했습니다. 작성자에게 찬사를 보냅니다! 이 코드는 무료로 사용할 수 있지만, 코드를 재게시하는 경우 하우스 룰이 적용된다는 점을 기억하세요.

면책사항
해당 정보와 게시물은 금융, 투자, 트레이딩 또는 기타 유형의 조언이나 권장 사항으로 간주되지 않으며, 트레이딩뷰에서 제공하거나 보증하는 것이 아닙니다. 자세한 내용은 이용 약관을 참조하세요.
오픈 소스 스크립트
트레이딩뷰의 진정한 정신에 따라, 이 스크립트의 작성자는 이를 오픈소스로 공개하여 트레이더들이 기능을 검토하고 검증할 수 있도록 했습니다. 작성자에게 찬사를 보냅니다! 이 코드는 무료로 사용할 수 있지만, 코드를 재게시하는 경우 하우스 룰이 적용된다는 점을 기억하세요.
면책사항
해당 정보와 게시물은 금융, 투자, 트레이딩 또는 기타 유형의 조언이나 권장 사항으로 간주되지 않으며, 트레이딩뷰에서 제공하거나 보증하는 것이 아닙니다. 자세한 내용은 이용 약관을 참조하세요.