Delta Exhaustion Reversal Strategy [Jayadev Rana]
WHAT IT IS
Delta Exhaustion Reversal Strategy looks for the moment a push into a new extreme runs out of aggressive participation. It estimates the volume delta of every chart bar from lower-timeframe data, accumulates it into a cumulative volume delta (CVD), and trades against a fresh extreme only when CVD fails to confirm it and the bar itself shows effort without result. Entries wait for a confirmation close. Exits combine a structure stop, an R-multiple target, a delta-reclaim exit and a time stop.
HOW IT WORKS
1. Intrabar delta. For each chart bar the script requests the lower-timeframe bars inside it (automatic choice: 1 minute for charts up to 5 minutes, 5 minutes up to 1 hour, 15 minutes up to 4 hours, 60 minutes above; or set manually) and sums up-bar volume minus down-bar volume. Where no intrabar data exists (older history) the bar's own direction and volume are used as a proxy, and the status table says which source is active. CVD is the running sum of bar delta.
2. Exhaustion bar. A bearish exhaustion needs all of the following on the same bar: the high is the highest high of the lookback window; CVD is below its own highest value of the previous window (price made a new high, buying pressure did not); the bar delta is positive while the close sits in the lower part of the bar's range (buyers were aggressive but could not hold the gains); and ATR(14) ranks above a minimum percentile so dead markets are skipped. The bullish exhaustion is the mirror image.
3. Confirmation. The setup stays pending for a few bars. A short is taken only when a later bar closes below the midpoint of the exhaustion bar; a long only when a later bar closes above it. If price trades beyond the exhaustion extreme while the setup is pending, the setup is cancelled.
4. Risk and exits. The stop is placed beyond the exhaustion bar's extreme plus an ATR buffer. The target is a fixed R multiple of that risk. Position size is computed from the stop distance and the risk-per-trade percentage of equity, capped at half of equity notional so no leverage is used. Two additional exits protect the trade: a delta-reclaim exit closes a losing position once delta has run against it for a set number of consecutive bars (the other side has taken control again), and a time stop closes anything that has not resolved within the maximum holding period.
ON THE CHART
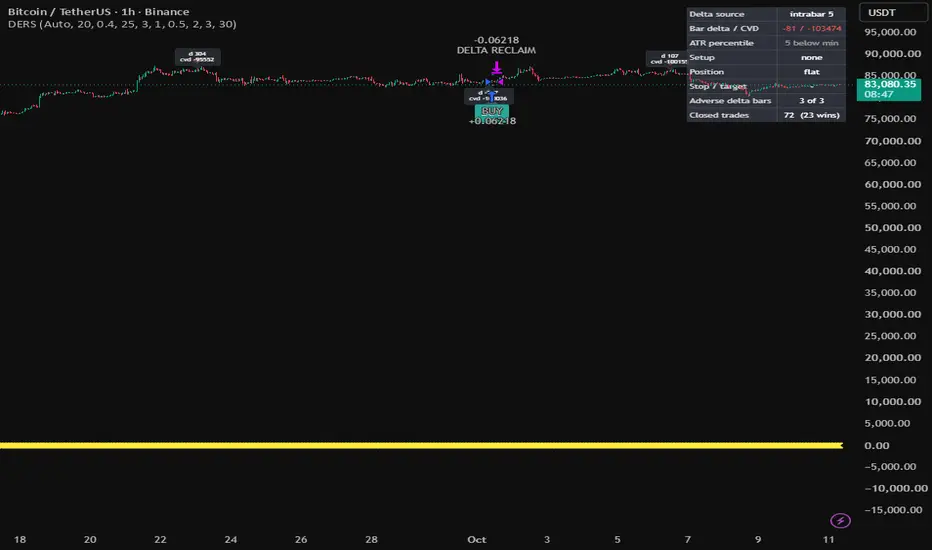
Diamonds and coloured bars mark exhaustion bars, with an optional label showing the bar delta and CVD. BUY and SELL labels mark entries, a cross marks every exit, and the active stop and target are drawn while a position is open. The status table reports the delta source, current delta and CVD, ATR percentile, pending setup, open position, stop and target, adverse-delta count and the closed-trade count. Data-window plots expose bar delta, CVD and the ATR percentile.
STRATEGY PROPERTIES USED
Initial capital 10,000. Commission 0.05% per side. Slippage 2 ticks. Orders are filled on the next bar open after the signal bar closes. No pyramiding. Position size from risk per trade (default 1% of equity) with a notional cap of 50% of equity. These are defaults; adjust them to the instrument and account you trade.
INPUTS
Delta engine: intrabar timeframe, extreme and divergence lookback, effort-failure close position, minimum ATR percentile, confirmation window.
Risk: risk per trade, stop buffer, target R multiple, delta-reclaim bars, time stop, long and short switches.
Display: CVD labels, status table.
ALERTS
The strategy calls alert() on long entry, short entry, position close and on every exhaustion bar. Create an alert on the strategy and choose the alert() events.
INTENDED USE
Liquid instruments with real volume (futures, large-cap stocks, major crypto pairs) on 5 minute to 4 hour charts. Volume delta from lower-timeframe bars is an estimate, not true bid-ask data, and on symbols without volume the delta is meaningless.
LIMITATIONS
TradingView serves a limited amount of intrabar history, so the delta estimate is only available on the most recent part of the chart; before that the strategy runs on the bar proxy. The exhaustion conditions are strict, so trade frequency is low. Results depend heavily on the symbol, timeframe and the lower timeframe chosen. Backtest fills, commission and slippage are approximations of live trading.
This script is published for study and research. It is not financial advice and past performance does not guarantee future results.
Delta Exhaustion Reversal Strategy looks for the moment a push into a new extreme runs out of aggressive participation. It estimates the volume delta of every chart bar from lower-timeframe data, accumulates it into a cumulative volume delta (CVD), and trades against a fresh extreme only when CVD fails to confirm it and the bar itself shows effort without result. Entries wait for a confirmation close. Exits combine a structure stop, an R-multiple target, a delta-reclaim exit and a time stop.
HOW IT WORKS
1. Intrabar delta. For each chart bar the script requests the lower-timeframe bars inside it (automatic choice: 1 minute for charts up to 5 minutes, 5 minutes up to 1 hour, 15 minutes up to 4 hours, 60 minutes above; or set manually) and sums up-bar volume minus down-bar volume. Where no intrabar data exists (older history) the bar's own direction and volume are used as a proxy, and the status table says which source is active. CVD is the running sum of bar delta.
2. Exhaustion bar. A bearish exhaustion needs all of the following on the same bar: the high is the highest high of the lookback window; CVD is below its own highest value of the previous window (price made a new high, buying pressure did not); the bar delta is positive while the close sits in the lower part of the bar's range (buyers were aggressive but could not hold the gains); and ATR(14) ranks above a minimum percentile so dead markets are skipped. The bullish exhaustion is the mirror image.
3. Confirmation. The setup stays pending for a few bars. A short is taken only when a later bar closes below the midpoint of the exhaustion bar; a long only when a later bar closes above it. If price trades beyond the exhaustion extreme while the setup is pending, the setup is cancelled.
4. Risk and exits. The stop is placed beyond the exhaustion bar's extreme plus an ATR buffer. The target is a fixed R multiple of that risk. Position size is computed from the stop distance and the risk-per-trade percentage of equity, capped at half of equity notional so no leverage is used. Two additional exits protect the trade: a delta-reclaim exit closes a losing position once delta has run against it for a set number of consecutive bars (the other side has taken control again), and a time stop closes anything that has not resolved within the maximum holding period.
ON THE CHART
Diamonds and coloured bars mark exhaustion bars, with an optional label showing the bar delta and CVD. BUY and SELL labels mark entries, a cross marks every exit, and the active stop and target are drawn while a position is open. The status table reports the delta source, current delta and CVD, ATR percentile, pending setup, open position, stop and target, adverse-delta count and the closed-trade count. Data-window plots expose bar delta, CVD and the ATR percentile.
STRATEGY PROPERTIES USED
Initial capital 10,000. Commission 0.05% per side. Slippage 2 ticks. Orders are filled on the next bar open after the signal bar closes. No pyramiding. Position size from risk per trade (default 1% of equity) with a notional cap of 50% of equity. These are defaults; adjust them to the instrument and account you trade.
INPUTS
Delta engine: intrabar timeframe, extreme and divergence lookback, effort-failure close position, minimum ATR percentile, confirmation window.
Risk: risk per trade, stop buffer, target R multiple, delta-reclaim bars, time stop, long and short switches.
Display: CVD labels, status table.
ALERTS
The strategy calls alert() on long entry, short entry, position close and on every exhaustion bar. Create an alert on the strategy and choose the alert() events.
INTENDED USE
Liquid instruments with real volume (futures, large-cap stocks, major crypto pairs) on 5 minute to 4 hour charts. Volume delta from lower-timeframe bars is an estimate, not true bid-ask data, and on symbols without volume the delta is meaningless.
LIMITATIONS
TradingView serves a limited amount of intrabar history, so the delta estimate is only available on the most recent part of the chart; before that the strategy runs on the bar proxy. The exhaustion conditions are strict, so trade frequency is low. Results depend heavily on the symbol, timeframe and the lower timeframe chosen. Backtest fills, commission and slippage are approximations of live trading.
This script is published for study and research. It is not financial advice and past performance does not guarantee future results.

면책사항
해당 정보와 게시물은 금융, 투자, 트레이딩 또는 기타 유형의 조언이나 권장 사항으로 간주되지 않으며, 트레이딩뷰에서 제공하거나 보증하는 것이 아닙니다. 자세한 내용은 이용 약관을 참조하세요.
면책사항
해당 정보와 게시물은 금융, 투자, 트레이딩 또는 기타 유형의 조언이나 권장 사항으로 간주되지 않으며, 트레이딩뷰에서 제공하거나 보증하는 것이 아닙니다. 자세한 내용은 이용 약관을 참조하세요.