OPEN-SOURCE SCRIPT
Smoothed ZLEMA Z-score
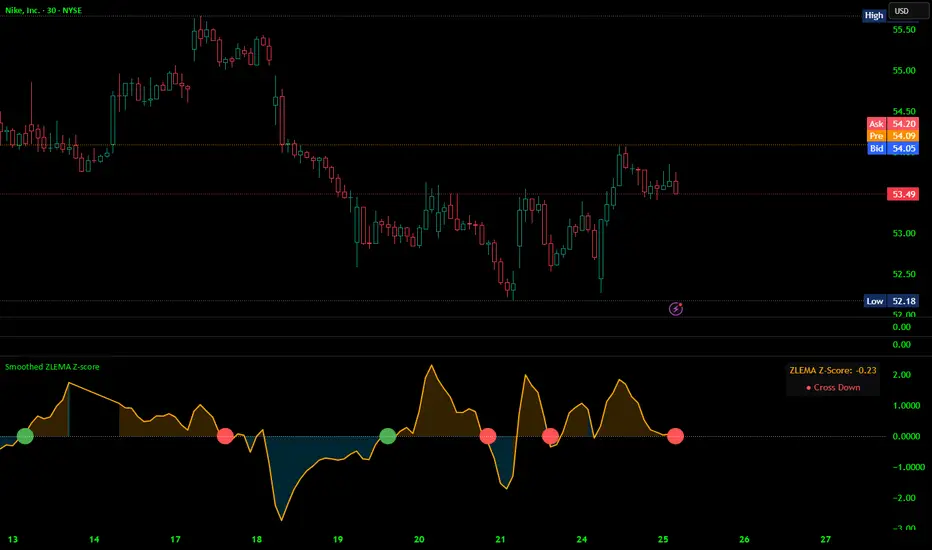
This indicator computes a Z-score of price using a Zero Lag EMA (ZLEMA) instead of a standard moving average, then applies a second ZLEMA pass to smooth the result. The output oscillates around zero — crossings of the zero line generate buy/sell signals with a configurable cooldown filter. Primary utility is as a mean-reversion and momentum-shift detector rather than a trend-following tool. Its edge comes from answering one specific question: has price moved so far from its dynamic equilibrium that a reversal is statistically due?
Because the mean is a ZLEMA (Zero Lag EMA) rather than a simple or standard EMA, it tracks price closely without the usual lag tax. This makes the Z-score more reactive — it rises and falls faster than a Bollinger-based oscillator, meaning it spends less time stuck at extremes after the actual turning point has already passed.
The smoothing pass on top then removes the noise that would otherwise cause whipsaws on that fast signal. So you get the best of both worlds: fast mean-tracking, clean signal output.
Practical applications:
Entries on mean-reversion setups — when the Z-score crosses back to zero from a stretched extreme (±1.5 to ±2.5 zone), it signals that price has returned to statistical normalcy, which is often the safest entry point.
Momentum confirmation — on a breakout, a zero-cross in the direction of the break confirms that price is not just stretching — it's shifting its mean relationship entirely.
Divergence reads — if price makes a new high but the Z-score makes a lower high, the move is losing statistical intensity even if it hasn't reversed yet.
The indicator is genuinely timeframe-agnostic but behaves differently at each scale: The key insight on timeframes: the Z-score's absolute value at any point is what matters more than the signal itself. On lower timeframes, ±1.5 is already extreme. On daily charts, the oscillator needs to push beyond ±2 before a zero-cross signal carries real weight.
The Mathematics —
What It's Actually Measuring:
The Z-score tells you how unusual the current price is relative to its recent self, expressed in standard deviation units. This is a statistical normalization — it strips away the actual price level and volatility of the asset, leaving only the relative displacement.
The ZLEMA twist modifies both the mean and the variance calculation. In a standard Bollinger-based Z-score, a simple moving average is the center. Here, the center is a zero-lag EMA — which means:
The mean itself moves toward current price faster
Variance is computed against that faster mean, so it captures dispersion around a more current reference point
The result is a Z-score that doesn't have the "stale mean" problem that plagues traditional oscillators in trending conditions
Visually, think of it this way: a standard deviation band around a slow SMA creates a wide tunnel that price has to escape to trigger a reading. A ZLEMA-based deviation band is a narrower, faster-moving tunnel that hugs price more tightly, so genuine outlier moves register more immediately.
The final smoothing pass converts the noisy raw Z-score (which can spike and collapse within a few bars) into a cleaner wave that crosses zero in a more deliberate, readable way. The quality of a zero-cross signal is directly proportional to how deep the Z-score was before crossing. A cross from −2.2 back above zero is a high-conviction mean-reversion. A cross from −0.4 is statistical noise dressed as a signal — the cooldown filter is your defense against those.
The fill coloring reinforces this: orange above zero, blue below. When the fill is deep and the cross happens, the visual contrast of the color flipping is itself a useful alert.
This indicator does not predict direction in a vacuum. A Z-score of +2.5 does not guarantee a decline — in a strong trending market, price can "ride the band" with the Z-score hovering at elevated levels for extended periods. The zero-cross signal is most reliable in mean-reverting market regimes (range-bound conditions, consolidation phases, overnight sessions in futures). In strong trends, signals against the trend direction should be filtered by a higher-timeframe trend indicator before acting on them.
How to Use It:
The indicator is best read as a mean-reversion oscillator with momentum context:
Z-score rising through zero from below = price reclaiming its ZLEMA mean, potential momentum shift upward
Z-score falling through zero from above = price breaking down through its mean
Extreme values (±2 or beyond) suggest price is statistically stretched and likely to revert
The cooldown parameter is important to tune — on trending instruments, increase it to avoid whipsaws; on ranging instruments, reducing it captures more turns
The ZLEMA backbone makes this more responsive than a traditional Bollinger-based Z-score, which can lag by several bars in fast-moving markets.
Disclaimer:
This indicator and any signals it generates are provided strictly for educational and informational purposes. Nothing presented here constitutes financial advice, investment advice, or a recommendation to buy or sell any financial instrument. Good Luck !!
Because the mean is a ZLEMA (Zero Lag EMA) rather than a simple or standard EMA, it tracks price closely without the usual lag tax. This makes the Z-score more reactive — it rises and falls faster than a Bollinger-based oscillator, meaning it spends less time stuck at extremes after the actual turning point has already passed.
The smoothing pass on top then removes the noise that would otherwise cause whipsaws on that fast signal. So you get the best of both worlds: fast mean-tracking, clean signal output.
Practical applications:
Entries on mean-reversion setups — when the Z-score crosses back to zero from a stretched extreme (±1.5 to ±2.5 zone), it signals that price has returned to statistical normalcy, which is often the safest entry point.
Momentum confirmation — on a breakout, a zero-cross in the direction of the break confirms that price is not just stretching — it's shifting its mean relationship entirely.
Divergence reads — if price makes a new high but the Z-score makes a lower high, the move is losing statistical intensity even if it hasn't reversed yet.
The indicator is genuinely timeframe-agnostic but behaves differently at each scale: The key insight on timeframes: the Z-score's absolute value at any point is what matters more than the signal itself. On lower timeframes, ±1.5 is already extreme. On daily charts, the oscillator needs to push beyond ±2 before a zero-cross signal carries real weight.
The Mathematics —
What It's Actually Measuring:
The Z-score tells you how unusual the current price is relative to its recent self, expressed in standard deviation units. This is a statistical normalization — it strips away the actual price level and volatility of the asset, leaving only the relative displacement.
The ZLEMA twist modifies both the mean and the variance calculation. In a standard Bollinger-based Z-score, a simple moving average is the center. Here, the center is a zero-lag EMA — which means:
The mean itself moves toward current price faster
Variance is computed against that faster mean, so it captures dispersion around a more current reference point
The result is a Z-score that doesn't have the "stale mean" problem that plagues traditional oscillators in trending conditions
Visually, think of it this way: a standard deviation band around a slow SMA creates a wide tunnel that price has to escape to trigger a reading. A ZLEMA-based deviation band is a narrower, faster-moving tunnel that hugs price more tightly, so genuine outlier moves register more immediately.
The final smoothing pass converts the noisy raw Z-score (which can spike and collapse within a few bars) into a cleaner wave that crosses zero in a more deliberate, readable way. The quality of a zero-cross signal is directly proportional to how deep the Z-score was before crossing. A cross from −2.2 back above zero is a high-conviction mean-reversion. A cross from −0.4 is statistical noise dressed as a signal — the cooldown filter is your defense against those.
The fill coloring reinforces this: orange above zero, blue below. When the fill is deep and the cross happens, the visual contrast of the color flipping is itself a useful alert.
This indicator does not predict direction in a vacuum. A Z-score of +2.5 does not guarantee a decline — in a strong trending market, price can "ride the band" with the Z-score hovering at elevated levels for extended periods. The zero-cross signal is most reliable in mean-reverting market regimes (range-bound conditions, consolidation phases, overnight sessions in futures). In strong trends, signals against the trend direction should be filtered by a higher-timeframe trend indicator before acting on them.
How to Use It:
The indicator is best read as a mean-reversion oscillator with momentum context:
Z-score rising through zero from below = price reclaiming its ZLEMA mean, potential momentum shift upward
Z-score falling through zero from above = price breaking down through its mean
Extreme values (±2 or beyond) suggest price is statistically stretched and likely to revert
The cooldown parameter is important to tune — on trending instruments, increase it to avoid whipsaws; on ranging instruments, reducing it captures more turns
The ZLEMA backbone makes this more responsive than a traditional Bollinger-based Z-score, which can lag by several bars in fast-moving markets.
Disclaimer:
This indicator and any signals it generates are provided strictly for educational and informational purposes. Nothing presented here constitutes financial advice, investment advice, or a recommendation to buy or sell any financial instrument. Good Luck !!
오픈 소스 스크립트
트레이딩뷰의 진정한 정신에 따라, 이 스크립트의 작성자는 이를 오픈소스로 공개하여 트레이더들이 기능을 검토하고 검증할 수 있도록 했습니다. 작성자에게 찬사를 보냅니다! 이 코드는 무료로 사용할 수 있지만, 코드를 재게시하는 경우 하우스 룰이 적용된다는 점을 기억하세요.

면책사항
해당 정보와 게시물은 금융, 투자, 트레이딩 또는 기타 유형의 조언이나 권장 사항으로 간주되지 않으며, 트레이딩뷰에서 제공하거나 보증하는 것이 아닙니다. 자세한 내용은 이용 약관을 참조하세요.
오픈 소스 스크립트
트레이딩뷰의 진정한 정신에 따라, 이 스크립트의 작성자는 이를 오픈소스로 공개하여 트레이더들이 기능을 검토하고 검증할 수 있도록 했습니다. 작성자에게 찬사를 보냅니다! 이 코드는 무료로 사용할 수 있지만, 코드를 재게시하는 경우 하우스 룰이 적용된다는 점을 기억하세요.
면책사항
해당 정보와 게시물은 금융, 투자, 트레이딩 또는 기타 유형의 조언이나 권장 사항으로 간주되지 않으며, 트레이딩뷰에서 제공하거나 보증하는 것이 아닙니다. 자세한 내용은 이용 약관을 참조하세요.