업데이트됨
XAUUSD Family Oscillator (XFO)
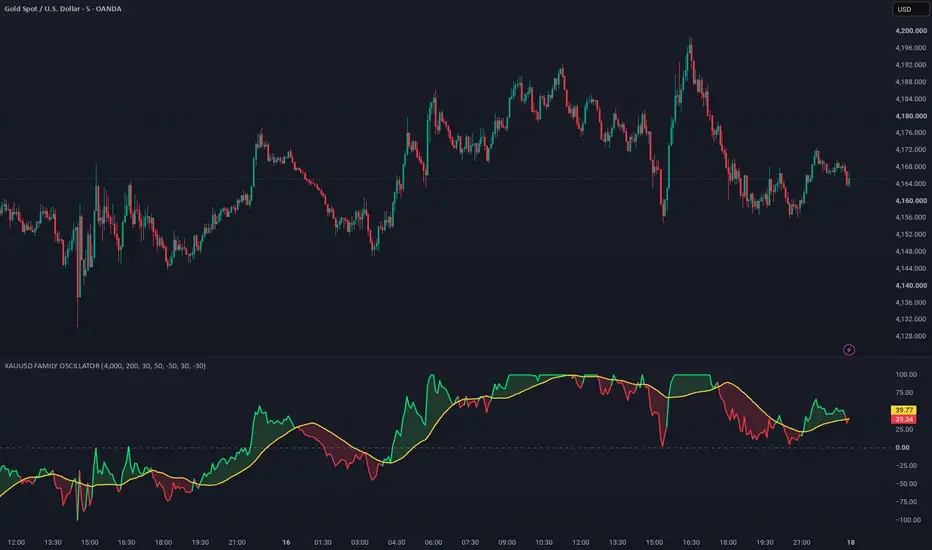
📘 XAUUSD Family Oscillator (XFO)
The XAUUSD Family Oscillator (XFO) is a technical indicator designed to visualize volatility-based momentum in the market.
It combines a volatility-adjusted channel with an oscillator and a smoothed signal line (SMA) to help traders identify potential overbought and oversold conditions, trend shifts, and strength changes in price movements.
The indicator is built around a mid-price SMA and dynamically adjusts its range based on recent candle volatility.
The oscillator reflects the position of the current price within this adaptive band, while the signal line provides a smoother trend confirmation.
Main Features:
Dynamic volatility-based oscillator.
Signal line (SMA) for trend confirmation.
Visual color change between bullish and bearish momentum.
Clean design — only oscillator and signal line shown.
Optional overbought/oversold reference levels for contextual analysis.
Disclaimer:
This indicator is for educational and analytical purposes only.
It is not financial advice and should not be used as a sole basis for investment decisions.
Always conduct your own analysis and manage risk responsibly.
The XAUUSD Family Oscillator (XFO) is a technical indicator designed to visualize volatility-based momentum in the market.
It combines a volatility-adjusted channel with an oscillator and a smoothed signal line (SMA) to help traders identify potential overbought and oversold conditions, trend shifts, and strength changes in price movements.
The indicator is built around a mid-price SMA and dynamically adjusts its range based on recent candle volatility.
The oscillator reflects the position of the current price within this adaptive band, while the signal line provides a smoother trend confirmation.
Main Features:
Dynamic volatility-based oscillator.
Signal line (SMA) for trend confirmation.
Visual color change between bullish and bearish momentum.
Clean design — only oscillator and signal line shown.
Optional overbought/oversold reference levels for contextual analysis.
Disclaimer:
This indicator is for educational and analytical purposes only.
It is not financial advice and should not be used as a sole basis for investment decisions.
Always conduct your own analysis and manage risk responsibly.
릴리즈 노트
Updated chart snapshot so the oscillator is clearly visible (5m chart).
면책사항
해당 정보와 게시물은 금융, 투자, 트레이딩 또는 기타 유형의 조언이나 권장 사항으로 간주되지 않으며, 트레이딩뷰에서 제공하거나 보증하는 것이 아닙니다. 자세한 내용은 이용 약관을 참조하세요.
면책사항
해당 정보와 게시물은 금융, 투자, 트레이딩 또는 기타 유형의 조언이나 권장 사항으로 간주되지 않으며, 트레이딩뷰에서 제공하거나 보증하는 것이 아닙니다. 자세한 내용은 이용 약관을 참조하세요.