OPEN-SOURCE SCRIPT
EMA Rejection Counter
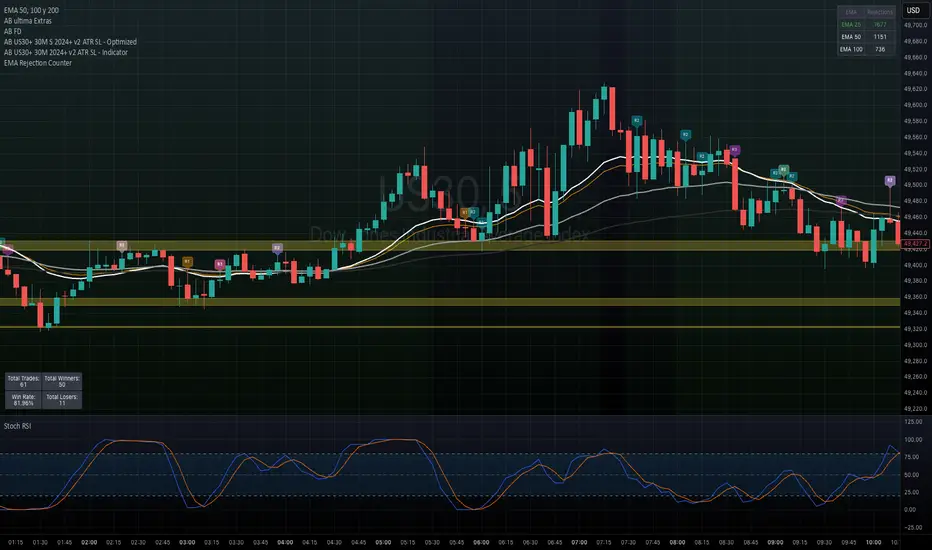
EMA Rejection Counter
EMA Rejection Counter is a simple yet powerful tool designed to measure how often price gets rejected from key exponential moving averages. Instead of guessing which EMA “respects price” the most, this indicator gives you actual data.
What It Does
This indicator tracks and counts rejection events on up to three customizable EMAs.
A rejection is defined as:
Price approaches the EMA
Touches the EMA during the candle
Then closes away from it
This helps identify which EMA is acting as the most reliable dynamic support/resistance.
Features
✅ Track 3 customizable EMAs (default: 25 / 50 / 100)
✅ Automatic detection of bullish & bearish rejections
✅ Live rejection counter for each EMA
✅ On-chart labels (R1, R2, R3) to visualize rejection points
✅ Clean table display showing total counts
✅ Highlights the most respected EMA in real-time
How to Use
Use this tool to identify which EMA price is reacting to most
Combine with your trend strategy (e.g., pullbacks, continuations)
The EMA with the highest rejection count often acts as the key level
Example Use Cases
Finding the best EMA for your strategy
Confirming dynamic support/resistance
Filtering entries based on EMA reactions
Enhancing trend-following systems
Notes
This is a statistical tool, not a standalone trading signal
Works best when combined with price action and market structure
Results may vary across timeframes and assets
EMA Rejection Counter is a simple yet powerful tool designed to measure how often price gets rejected from key exponential moving averages. Instead of guessing which EMA “respects price” the most, this indicator gives you actual data.
What It Does
This indicator tracks and counts rejection events on up to three customizable EMAs.
A rejection is defined as:
Price approaches the EMA
Touches the EMA during the candle
Then closes away from it
This helps identify which EMA is acting as the most reliable dynamic support/resistance.
Features
✅ Track 3 customizable EMAs (default: 25 / 50 / 100)
✅ Automatic detection of bullish & bearish rejections
✅ Live rejection counter for each EMA
✅ On-chart labels (R1, R2, R3) to visualize rejection points
✅ Clean table display showing total counts
✅ Highlights the most respected EMA in real-time
How to Use
Use this tool to identify which EMA price is reacting to most
Combine with your trend strategy (e.g., pullbacks, continuations)
The EMA with the highest rejection count often acts as the key level
Example Use Cases
Finding the best EMA for your strategy
Confirming dynamic support/resistance
Filtering entries based on EMA reactions
Enhancing trend-following systems
Notes
This is a statistical tool, not a standalone trading signal
Works best when combined with price action and market structure
Results may vary across timeframes and assets
오픈 소스 스크립트
트레이딩뷰의 진정한 정신에 따라, 이 스크립트의 작성자는 이를 오픈소스로 공개하여 트레이더들이 기능을 검토하고 검증할 수 있도록 했습니다. 작성자에게 찬사를 보냅니다! 이 코드는 무료로 사용할 수 있지만, 코드를 재게시하는 경우 하우스 룰이 적용된다는 점을 기억하세요.

면책사항
해당 정보와 게시물은 금융, 투자, 트레이딩 또는 기타 유형의 조언이나 권장 사항으로 간주되지 않으며, 트레이딩뷰에서 제공하거나 보증하는 것이 아닙니다. 자세한 내용은 이용 약관을 참조하세요.
오픈 소스 스크립트
트레이딩뷰의 진정한 정신에 따라, 이 스크립트의 작성자는 이를 오픈소스로 공개하여 트레이더들이 기능을 검토하고 검증할 수 있도록 했습니다. 작성자에게 찬사를 보냅니다! 이 코드는 무료로 사용할 수 있지만, 코드를 재게시하는 경우 하우스 룰이 적용된다는 점을 기억하세요.
면책사항
해당 정보와 게시물은 금융, 투자, 트레이딩 또는 기타 유형의 조언이나 권장 사항으로 간주되지 않으며, 트레이딩뷰에서 제공하거나 보증하는 것이 아닙니다. 자세한 내용은 이용 약관을 참조하세요.