OPEN-SOURCE SCRIPT
Hitesh Nimje Indicator
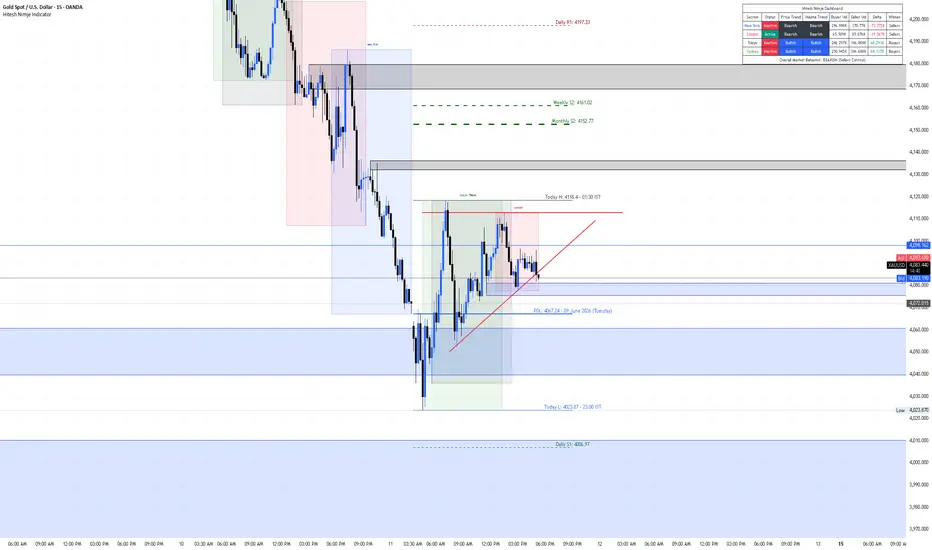
# Hitesh Nimje Indicator
The **Hitesh Nimje Indicator** is a comprehensive all-in-one market structure and session analysis tool designed for intraday, swing, and institutional-style traders. It combines multi-timeframe key levels, global market session tracking, support/resistance zones, session volume analysis, VWAP, trend detection, and an advanced market dashboard into a single indicator.
## Key Features
### Multi-Timeframe Highs & Lows
Track important market reference levels directly on your chart:
* Today's High & Low
* Previous Day High & Low (PDH / PDL)
* Previous Week High & Low (PWH / PWL)
* Previous Month High & Low (PMH / PML)
* All-Time High & Low (ATH / ATL)
Each level is automatically updated and labeled for easy identification.
### Dynamic Support & Resistance
Built-in standard pivot calculations provide:
* Daily R1, R2, S1, S2
* Weekly R1, R2, S1, S2
* Monthly R1, R2, S1, S2
These levels help identify potential reversal zones, breakout areas, and profit targets.
### Global Market Session Tracking
Monitor major trading sessions simultaneously:
* New York Session
* London Session
* Tokyo Session
* Sydney Session
Each session can be independently customized with:
* Session Range Boxes
* Trendlines
* Session Mean Price
* Session VWAP
* Session High/Low Tracking
### Session Range Analysis
Visual session boxes display:
* Session High
* Session Low
* Price Expansion
* Market Volatility
This allows traders to quickly identify liquidity zones and session breakout opportunities.
### Session VWAP
Calculate a separate VWAP for each trading session to help determine:
* Institutional price positioning
* Fair value areas
* Potential support and resistance levels
### Session Trend Detection
Built-in linear regression analysis identifies the dominant direction within each session:
* Bullish Trend
* Bearish Trend
Useful for aligning trades with session momentum.
### Volume Delta Analysis
The indicator measures:
* Buyer Volume
* Seller Volume
* Volume Delta
This provides insight into which side of the market is currently in control.
### Advanced Market Dashboard
The dashboard displays real-time information for all sessions, including:
* Session Status (Active / Inactive)
* Price Trend
* Volume Trend
* Buyer Volume
* Seller Volume
* Volume Delta
* Dominant Market Side (Buyers / Sellers)
An overall market sentiment summary is also generated automatically.
### Timezone Flexibility
Choose between:
* Exchange Timezone
* Custom Timezone
This makes the indicator suitable for traders worldwide.
### Session & Daily Dividers
Optional visual dividers help separate:
* Trading Sessions
* Trading Days
for improved chart readability.
## Best Used For
* Intraday Trading
* Scalping
* Futures Trading
* Forex Trading
* Index Trading
* Session Breakout Strategies
* Smart Money Concepts (SMC)
* ICT-Based Trading Approaches
* Liquidity and Range Analysis
## Notes
* Works on all markets and timeframes.
* For best results, use intraday charts where session activity and volume behavior are most relevant.
* Session times are fully customizable to match your trading style and market preferences.
Thank you for using the Hitesh Nimje Indicator. Trade smart, manage risk, and always follow your trading plan.
오픈 소스 스크립트
트레이딩뷰의 진정한 정신에 따라, 이 스크립트의 작성자는 이를 오픈소스로 공개하여 트레이더들이 기능을 검토하고 검증할 수 있도록 했습니다. 작성자에게 찬사를 보냅니다! 이 코드는 무료로 사용할 수 있지만, 코드를 재게시하는 경우 하우스 룰이 적용된다는 점을 기억하세요.

면책사항
해당 정보와 게시물은 금융, 투자, 트레이딩 또는 기타 유형의 조언이나 권장 사항으로 간주되지 않으며, 트레이딩뷰에서 제공하거나 보증하는 것이 아닙니다. 자세한 내용은 이용 약관을 참조하세요.
오픈 소스 스크립트
트레이딩뷰의 진정한 정신에 따라, 이 스크립트의 작성자는 이를 오픈소스로 공개하여 트레이더들이 기능을 검토하고 검증할 수 있도록 했습니다. 작성자에게 찬사를 보냅니다! 이 코드는 무료로 사용할 수 있지만, 코드를 재게시하는 경우 하우스 룰이 적용된다는 점을 기억하세요.
면책사항
해당 정보와 게시물은 금융, 투자, 트레이딩 또는 기타 유형의 조언이나 권장 사항으로 간주되지 않으며, 트레이딩뷰에서 제공하거나 보증하는 것이 아닙니다. 자세한 내용은 이용 약관을 참조하세요.