OPEN-SOURCE SCRIPT
업데이트됨 RSI StdDev Trend Breakout
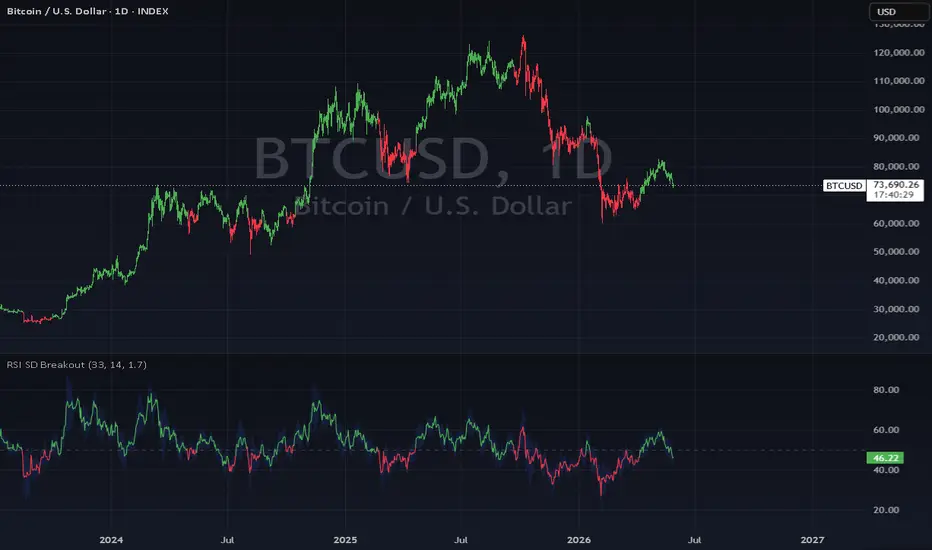
Overview
RSI StdDev Trend Breakout is a hybrid momentum and trend indicator built on the Relative Strength Index. It applies dynamic standard deviation bands directly to the RSI to detect meaningful breakout conditions, then uses the RSI midline as a trend filter to confirm bullish or bearish bias.
How It Works
The indicator calculates upper and lower standard deviation bands around the RSI. A bullish signal is triggered when the RSI breaks above the prior upper band while remaining above the midline, indicating upside momentum with trend confirmation. A bearish signal is triggered when the RSI breaks below the prior lower band while remaining below the midline, indicating downside momentum with trend confirmation. Once a bias is established, it persists until the opposing condition is met.
Visual Features
RSI line and candle colors update dynamically based on the current bullish or bearish state
Upper and lower standard deviation bands plotted with a filled channel for quick visual reference
Midline reference at 50 for trend context
Inputs
RSI Length - controls the RSI calculation period
StdDev Period - controls the lookback for standard deviation band calculation
StdDev Multiplier - adjusts the width of the bands
Alerts
Bullish: RSI > 50 and breaks above the upper standard deviation band
Bearish: RSI < 50 and breaks below the lower standard deviation band
RSI StdDev Trend Breakout is a hybrid momentum and trend indicator built on the Relative Strength Index. It applies dynamic standard deviation bands directly to the RSI to detect meaningful breakout conditions, then uses the RSI midline as a trend filter to confirm bullish or bearish bias.
How It Works
The indicator calculates upper and lower standard deviation bands around the RSI. A bullish signal is triggered when the RSI breaks above the prior upper band while remaining above the midline, indicating upside momentum with trend confirmation. A bearish signal is triggered when the RSI breaks below the prior lower band while remaining below the midline, indicating downside momentum with trend confirmation. Once a bias is established, it persists until the opposing condition is met.
Visual Features
RSI line and candle colors update dynamically based on the current bullish or bearish state
Upper and lower standard deviation bands plotted with a filled channel for quick visual reference
Midline reference at 50 for trend context
Inputs
RSI Length - controls the RSI calculation period
StdDev Period - controls the lookback for standard deviation band calculation
StdDev Multiplier - adjusts the width of the bands
Alerts
Bullish: RSI > 50 and breaks above the upper standard deviation band
Bearish: RSI < 50 and breaks below the lower standard deviation band
릴리즈 노트
.오픈 소스 스크립트
트레이딩뷰의 진정한 정신에 따라, 이 스크립트의 작성자는 이를 오픈소스로 공개하여 트레이더들이 기능을 검토하고 검증할 수 있도록 했습니다. 작성자에게 찬사를 보냅니다! 이 코드는 무료로 사용할 수 있지만, 코드를 재게시하는 경우 하우스 룰이 적용된다는 점을 기억하세요.

면책사항
해당 정보와 게시물은 금융, 투자, 트레이딩 또는 기타 유형의 조언이나 권장 사항으로 간주되지 않으며, 트레이딩뷰에서 제공하거나 보증하는 것이 아닙니다. 자세한 내용은 이용 약관을 참조하세요.
오픈 소스 스크립트
트레이딩뷰의 진정한 정신에 따라, 이 스크립트의 작성자는 이를 오픈소스로 공개하여 트레이더들이 기능을 검토하고 검증할 수 있도록 했습니다. 작성자에게 찬사를 보냅니다! 이 코드는 무료로 사용할 수 있지만, 코드를 재게시하는 경우 하우스 룰이 적용된다는 점을 기억하세요.
면책사항
해당 정보와 게시물은 금융, 투자, 트레이딩 또는 기타 유형의 조언이나 권장 사항으로 간주되지 않으며, 트레이딩뷰에서 제공하거나 보증하는 것이 아닙니다. 자세한 내용은 이용 약관을 참조하세요.