OPEN-SOURCE SCRIPT
FLEE MTF Context & Range
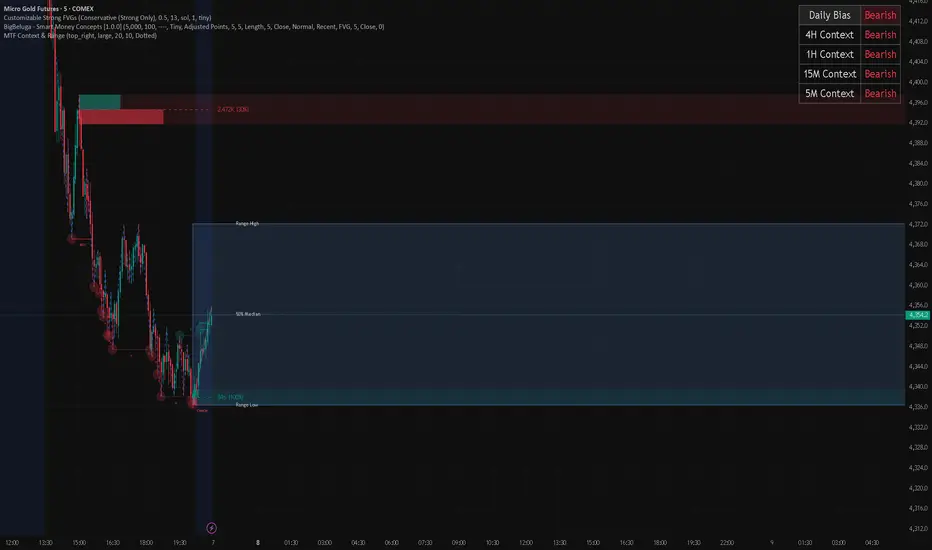
This indicator is a multi-timeframe market context tool. Its job is to help you quickly understand what the market is doing across multiple timeframes and what range price is currently trading inside.
It shows a context table in the top-right corner of the chart. That table tells you the trend direction for the 4H, 1H, 15M, and 5M timeframes. Each timeframe will show whether price is bullish, bearish, or neutral.
At the top of the table, it also shows the Daily overall bias. The daily bias is the main direction of the market, so you can quickly see whether the bigger picture is leaning bullish or bearish before taking trades on the lower timeframes.
The indicator also identifies the current range price is moving inside. When price is consolidating or trading between a high and a low, the indicator draws a transparent box around that range. The top of the box marks the range high, and the bottom marks the range low.
Inside the range box, the indicator draws a dotted 50% median line. This helps you see whether price is trading in the upper half or lower half of the range. The median can help with bias, entries, and understanding whether price is closer to premium or discount.
The indicator updates as the market moves. When a new range forms, the old range can disappear or stay depending on the settings. You can customize the colors, transparency, labels, timeframe options, and how sensitive the range detection is.
In simple words: this indicator tells you the trend on the higher and lower timeframes, gives you the daily bias, and visually marks the current price range with a 50% line so you can make cleaner trading decisions.
It shows a context table in the top-right corner of the chart. That table tells you the trend direction for the 4H, 1H, 15M, and 5M timeframes. Each timeframe will show whether price is bullish, bearish, or neutral.
At the top of the table, it also shows the Daily overall bias. The daily bias is the main direction of the market, so you can quickly see whether the bigger picture is leaning bullish or bearish before taking trades on the lower timeframes.
The indicator also identifies the current range price is moving inside. When price is consolidating or trading between a high and a low, the indicator draws a transparent box around that range. The top of the box marks the range high, and the bottom marks the range low.
Inside the range box, the indicator draws a dotted 50% median line. This helps you see whether price is trading in the upper half or lower half of the range. The median can help with bias, entries, and understanding whether price is closer to premium or discount.
The indicator updates as the market moves. When a new range forms, the old range can disappear or stay depending on the settings. You can customize the colors, transparency, labels, timeframe options, and how sensitive the range detection is.
In simple words: this indicator tells you the trend on the higher and lower timeframes, gives you the daily bias, and visually marks the current price range with a 50% line so you can make cleaner trading decisions.
오픈 소스 스크립트
트레이딩뷰의 진정한 정신에 따라, 이 스크립트의 작성자는 이를 오픈소스로 공개하여 트레이더들이 기능을 검토하고 검증할 수 있도록 했습니다. 작성자에게 찬사를 보냅니다! 이 코드는 무료로 사용할 수 있지만, 코드를 재게시하는 경우 하우스 룰이 적용된다는 점을 기억하세요.

면책사항
해당 정보와 게시물은 금융, 투자, 트레이딩 또는 기타 유형의 조언이나 권장 사항으로 간주되지 않으며, 트레이딩뷰에서 제공하거나 보증하는 것이 아닙니다. 자세한 내용은 이용 약관을 참조하세요.
오픈 소스 스크립트
트레이딩뷰의 진정한 정신에 따라, 이 스크립트의 작성자는 이를 오픈소스로 공개하여 트레이더들이 기능을 검토하고 검증할 수 있도록 했습니다. 작성자에게 찬사를 보냅니다! 이 코드는 무료로 사용할 수 있지만, 코드를 재게시하는 경우 하우스 룰이 적용된다는 점을 기억하세요.
면책사항
해당 정보와 게시물은 금융, 투자, 트레이딩 또는 기타 유형의 조언이나 권장 사항으로 간주되지 않으며, 트레이딩뷰에서 제공하거나 보증하는 것이 아닙니다. 자세한 내용은 이용 약관을 참조하세요.