Historical Impulse Zones [SMRT Algo]
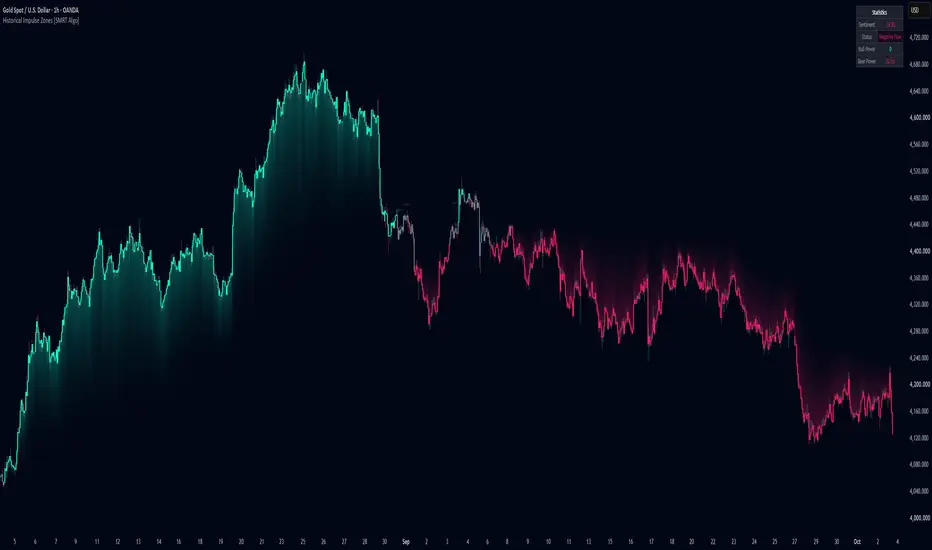
Historical Impulse Zones measures how strongly buyers and sellers have been pushing price, using the levels left behind by recent impulse moves. It turns that pressure into a single sentiment reading, colours the candles by the current state and shades the active bullish and bearish reference zones. This helps you see at a glance whether the market is in Positive Flow, Negative Flow or a Stability Phase.

How It Works
What You See on the Chart
Use Cases

How to Use the Settings


Dashboard Settings
Notes and Limitations
How It Works
- Impulse Detection: a bullish impulse is recorded when a candle's low gaps above the high from two bars earlier, the middle candle closes above that high, and the gap is larger than ATR × Impulse ATR Multiplier. A bearish impulse is the mirror image. Small gaps below the ATR filter are ignored.
- Reference Levels: the levels from the most recent impulses (up to the Reference Lookback) are averaged into one bullish reference level and one bearish reference level. If no impulse has formed yet, the lowest low or highest high of the lookback is used instead.
- Bull Power and Bear Power: each side is scored from 0 to 100. 55% of the score comes from how far price has extended away from the reference level within the lookback range. 45% comes from how far the source is from the reference level, measured in ATR.
- Sentiment: Bull Power minus Bear Power, smoothed with an EMA. It ranges from -100 to +100.
- Status: Sentiment above the Gray Zone Threshold is Positive Flow. Below the negative threshold is Negative Flow. Anything in between is a Stability Phase.
What You See on the Chart
- Candle Colours: teal for Positive Flow, pink for Negative Flow, gray for Stability Phase
- Bullish Zone: teal shading between price and the bullish reference level while price trades above it
- Bearish Zone: pink shading between price and the bearish reference level while price trades below it
- Dashboard: current Sentiment, Status, Bull Power and Bear Power
Use Cases
- Pullbacks Within a Trend: if price pulls back but the status stays Positive Flow (or Negative Flow in a downtrend), the underlying pressure has not shifted. This can help you judge whether a pullback is a potential continuation setup or the start of a change.
- Pressure Shifts: a move from Positive Flow through a Stability Phase into Negative Flow (or the reverse) shows the balance of pressure changing over time, rather than on a single candle.
- Counter Moves: a brief bullish push inside a bearish phase that never changes the status helps you see that the move did not change the wider pressure.
- Stability Phases: gray candles show that neither side has clear control. Many traders use these periods to stand aside or wait for the next directional phase.
- Directional Moves: during sustained moves the status stays coloured and the zone shading widens. This helps you follow how far price has moved away from its reference level.
How to Use the Settings
- Gray Zone Threshold sets how strong the sentiment reading must be before it counts as Positive Flow or Negative Flow. Higher values mark more of the chart as Stability Phase, so only stronger directional pressure is coloured.
- Impulse ATR Multiplier sets how large a gap must be, relative to ATR, to count as an impulse. Higher values keep only larger gaps, which changes the reference levels and how sentiment reads. Lower values pick up more, smaller impulses.
- Reference Lookback sets how many recent impulses are averaged into each reference level, and the range used for the power calculations. Higher values give steadier levels; lower values react faster.
- Sentiment Smoothing sets the EMA length applied to sentiment. Higher values reduce switching between states; lower values respond sooner.
- ATR Length is the period used to measure volatility for impulse detection and the power readings.
- Source is the price used in the ATR distance component (Close by default).
- Colours set the Positive Flow, Negative Flow and Stability Phase colours.
Dashboard Settings
- Dashboard: show or hide the statistics table
- Location: Top Right, Bottom Right or Bottom Left
- Size: Tiny, Small or Normal
Notes and Limitations
- The script uses only the chart's own data, with no higher-timeframe requests and no future data.
- Values on historical bars do not change. On the live bar, Sentiment, Status and candle colour update in real time and are only confirmed when the bar closes.
- Readings describe past and current buying and selling pressure. They do not predict future price movement.
- Default settings are a starting point. Different markets and timeframes may need different thresholds.
- Use this tool alongside your own analysis and risk management. It is not financial advice.

Get access: smrtalgo.com
Join our Discord: discord.com/invite/f7gVrMPkaC
All content provided by SMRT Algo is for informational & educational purposes only. Past performance does not guarantee future results.
Join our Discord: discord.com/invite/f7gVrMPkaC
All content provided by SMRT Algo is for informational & educational purposes only. Past performance does not guarantee future results.
면책사항
해당 정보와 게시물은 금융, 투자, 트레이딩 또는 기타 유형의 조언이나 권장 사항으로 간주되지 않으며, 트레이딩뷰에서 제공하거나 보증하는 것이 아닙니다. 자세한 내용은 이용 약관을 참조하세요.
Get access: smrtalgo.com
Join our Discord: discord.com/invite/f7gVrMPkaC
All content provided by SMRT Algo is for informational & educational purposes only. Past performance does not guarantee future results.
Join our Discord: discord.com/invite/f7gVrMPkaC
All content provided by SMRT Algo is for informational & educational purposes only. Past performance does not guarantee future results.
면책사항
해당 정보와 게시물은 금융, 투자, 트레이딩 또는 기타 유형의 조언이나 권장 사항으로 간주되지 않으며, 트레이딩뷰에서 제공하거나 보증하는 것이 아닙니다. 자세한 내용은 이용 약관을 참조하세요.