OPEN-SOURCE SCRIPT
Masayan Volume Zone Profile Indicator
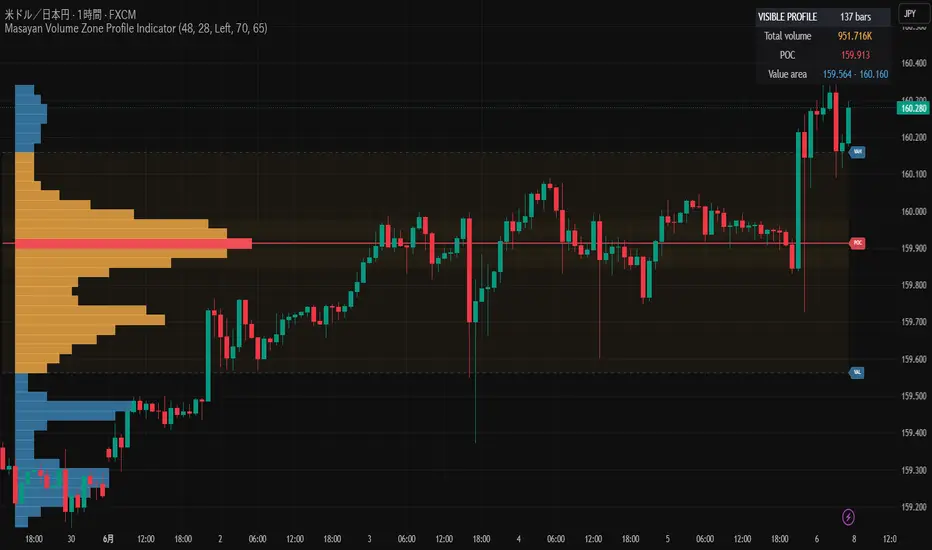
Masayan Volume Zone Profile Indicator is a dynamic volume-zone analysis tool that automatically calculates an estimated volume profile from all bars currently visible on the chart.
The indicator detects the chart’s visible range and recalculates whenever the user scrolls or zooms. No fixed lookback period is required.
Each visible candle’s TradingView volume is distributed across the price rows overlapped by its high-low range. The resulting profile highlights the price zones where the greatest estimated volume was concentrated.
Main features:
Automatic visible-chart range detection
Dynamic recalculation when scrolling or zooming
Estimated price-by-volume profile
Visible-range total volume summary
Estimated Point of Control
Value Area High and Value Area Low
Highlighted high-volume zones
Left or right profile positioning
POC-cross and value-area-entry alerts
Optional display controls
The profile is always drawn inside the currently visible chart range. Value-area volume bars are displayed in orange, volume outside the value area is displayed in blue, and the Point of Control is highlighted in red.
This indicator does not use broker order-book data, actual bid/ask volume, or market participant positions. The displayed profile is estimated from TradingView volume data and candle price ranges.
For forex symbols, TradingView volume may represent tick volume rather than centralized traded volume.
This script is intended for chart analysis, research, and educational purposes only.
It does not guarantee future performance and should not be considered financial advice.
Please test carefully before using it in any trading decision.
The indicator detects the chart’s visible range and recalculates whenever the user scrolls or zooms. No fixed lookback period is required.
Each visible candle’s TradingView volume is distributed across the price rows overlapped by its high-low range. The resulting profile highlights the price zones where the greatest estimated volume was concentrated.
Main features:
Automatic visible-chart range detection
Dynamic recalculation when scrolling or zooming
Estimated price-by-volume profile
Visible-range total volume summary
Estimated Point of Control
Value Area High and Value Area Low
Highlighted high-volume zones
Left or right profile positioning
POC-cross and value-area-entry alerts
Optional display controls
The profile is always drawn inside the currently visible chart range. Value-area volume bars are displayed in orange, volume outside the value area is displayed in blue, and the Point of Control is highlighted in red.
This indicator does not use broker order-book data, actual bid/ask volume, or market participant positions. The displayed profile is estimated from TradingView volume data and candle price ranges.
For forex symbols, TradingView volume may represent tick volume rather than centralized traded volume.
This script is intended for chart analysis, research, and educational purposes only.
It does not guarantee future performance and should not be considered financial advice.
Please test carefully before using it in any trading decision.
오픈 소스 스크립트
트레이딩뷰의 진정한 정신에 따라, 이 스크립트의 작성자는 이를 오픈소스로 공개하여 트레이더들이 기능을 검토하고 검증할 수 있도록 했습니다. 작성자에게 찬사를 보냅니다! 이 코드는 무료로 사용할 수 있지만, 코드를 재게시하는 경우 하우스 룰이 적용된다는 점을 기억하세요.

면책사항
해당 정보와 게시물은 금융, 투자, 트레이딩 또는 기타 유형의 조언이나 권장 사항으로 간주되지 않으며, 트레이딩뷰에서 제공하거나 보증하는 것이 아닙니다. 자세한 내용은 이용 약관을 참조하세요.
오픈 소스 스크립트
트레이딩뷰의 진정한 정신에 따라, 이 스크립트의 작성자는 이를 오픈소스로 공개하여 트레이더들이 기능을 검토하고 검증할 수 있도록 했습니다. 작성자에게 찬사를 보냅니다! 이 코드는 무료로 사용할 수 있지만, 코드를 재게시하는 경우 하우스 룰이 적용된다는 점을 기억하세요.
면책사항
해당 정보와 게시물은 금융, 투자, 트레이딩 또는 기타 유형의 조언이나 권장 사항으로 간주되지 않으며, 트레이딩뷰에서 제공하거나 보증하는 것이 아닙니다. 자세한 내용은 이용 약관을 참조하세요.