OPEN-SOURCE SCRIPT
Adaptive Bounds RSI [LuxAlgo]
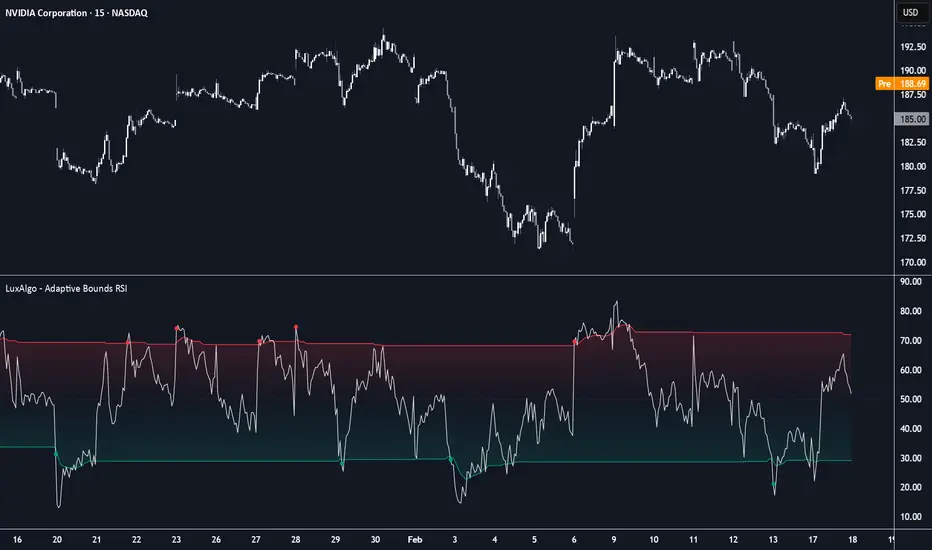
The Adaptive Bounds RSI indicator utilizes online 1D K-Means clustering to dynamically adapt RSI overbought and oversold bounds based on evolving market conditions. Unlike traditional RSI thresholds (70/30) that remain static, this tool identifies five shifting clusters to better categorize price action into regimes ranging from deep discount to extreme premium.
🔶 USAGE
The indicator provides a more responsive way to identify overextended market conditions by learning from recent RSI distributions. Instead of relying on fixed levels that may be irrelevant in strong trends, the adaptive bounds expand and contract based on the volatility and momentum of the asset.
🔹 Regime Classification
The tool classifies the market into five distinct regimes based on five internal centroids (clusters):
🔹 Signal Markers
The indicator plots circular markers directly on the RSI line when the oscillator crosses the adaptive bounds:
To prevent signal clutter, these markers only reappear once the RSI has returned to cross the 50-level midline, ensuring the market has "reset" before a new overextended signal is generated.
🔶 DETAILS
The core of this indicator is an Online 1D K-Means algorithm. Unlike standard clustering which requires a full dataset, this online version updates its centroids bar-by-bar.
When a new RSI value is calculated, the algorithm determines which of the five centroids is closest to that value. It then shifts that "winning" centroid toward the RSI value by a factor determined by the Learning Rate. This allows the boundaries to "breathe" with the market; in a persistent uptrend, the upper bound will naturally migrate higher to avoid premature overbought signals.
🔶 SETTINGS
🔹 Oscillator Settings
🔹 K-Means Settings
🔹 Visuals
🔶 ALERTS
🔶 USAGE
The indicator provides a more responsive way to identify overextended market conditions by learning from recent RSI distributions. Instead of relying on fixed levels that may be irrelevant in strong trends, the adaptive bounds expand and contract based on the volatility and momentum of the asset.
🔹 Regime Classification
The tool classifies the market into five distinct regimes based on five internal centroids (clusters):
- Extreme Premium (Upper Bound): Represents highly overextended bullish conditions.
- Bullish: The zone between the center and the upper bound.
- Neutral: The area surrounding the 50-level midline.
- Bearish: The zone between the center and the lower bound.
- Deep Discount (Lower Bound): Represents highly overextended bearish conditions.
🔹 Signal Markers
The indicator plots circular markers directly on the RSI line when the oscillator crosses the adaptive bounds:
- A Bullish Marker appears when the RSI crosses below the adaptive lower bound (Deep Discount).
- A Bearish Marker appears when the RSI crosses above the adaptive upper bound (Extreme Premium).
To prevent signal clutter, these markers only reappear once the RSI has returned to cross the 50-level midline, ensuring the market has "reset" before a new overextended signal is generated.
🔶 DETAILS
The core of this indicator is an Online 1D K-Means algorithm. Unlike standard clustering which requires a full dataset, this online version updates its centroids bar-by-bar.
When a new RSI value is calculated, the algorithm determines which of the five centroids is closest to that value. It then shifts that "winning" centroid toward the RSI value by a factor determined by the Learning Rate. This allows the boundaries to "breathe" with the market; in a persistent uptrend, the upper bound will naturally migrate higher to avoid premature overbought signals.
🔶 SETTINGS
🔹 Oscillator Settings
- RSI Length: Determines the lookback period for the underlying Relative Strength Index calculation.
🔹 K-Means Settings
- Learning Rate (K-Means): Controls how quickly the adaptive bounds react to new data. A higher value makes the bounds move faster, while a lower value provides more stable, "sticky" boundaries.
🔹 Visuals
- Lower Bound Color: Sets the color for the lower adaptive boundary and bullish signals.
- Upper Bound Color: Sets the color for the upper adaptive boundary and bearish signals.
- Auto RSI Color: When enabled, the RSI line matches the chart's foreground color.
- RSI Color: Sets the color of the RSI line when "Auto RSI Color" is disabled.
🔶 ALERTS
- Regime Flip: Triggers when the market transitions from a Neutral state into a trending cluster (Bullish or Bearish).
- Lower Bound Cross: Triggers when the RSI crosses into the Deep Discount zone.
- Upper Bound Cross: Triggers when the RSI crosses into the Extreme Premium zone.
오픈 소스 스크립트
트레이딩뷰의 진정한 정신에 따라, 이 스크립트의 작성자는 이를 오픈소스로 공개하여 트레이더들이 기능을 검토하고 검증할 수 있도록 했습니다. 작성자에게 찬사를 보냅니다! 이 코드는 무료로 사용할 수 있지만, 코드를 재게시하는 경우 하우스 룰이 적용된다는 점을 기억하세요.

Build your own edge with AI: luxalgo.com
All content provided by LuxAlgo is for informational & educational purposes only. Past performance does not guarantee future results.
All content provided by LuxAlgo is for informational & educational purposes only. Past performance does not guarantee future results.
면책사항
해당 정보와 게시물은 금융, 투자, 트레이딩 또는 기타 유형의 조언이나 권장 사항으로 간주되지 않으며, 트레이딩뷰에서 제공하거나 보증하는 것이 아닙니다. 자세한 내용은 이용 약관을 참조하세요.
오픈 소스 스크립트
트레이딩뷰의 진정한 정신에 따라, 이 스크립트의 작성자는 이를 오픈소스로 공개하여 트레이더들이 기능을 검토하고 검증할 수 있도록 했습니다. 작성자에게 찬사를 보냅니다! 이 코드는 무료로 사용할 수 있지만, 코드를 재게시하는 경우 하우스 룰이 적용된다는 점을 기억하세요.
Build your own edge with AI: luxalgo.com
All content provided by LuxAlgo is for informational & educational purposes only. Past performance does not guarantee future results.
All content provided by LuxAlgo is for informational & educational purposes only. Past performance does not guarantee future results.
면책사항
해당 정보와 게시물은 금융, 투자, 트레이딩 또는 기타 유형의 조언이나 권장 사항으로 간주되지 않으며, 트레이딩뷰에서 제공하거나 보증하는 것이 아닙니다. 자세한 내용은 이용 약관을 참조하세요.