OPEN-SOURCE SCRIPT
업데이트됨 Bollinger Bands with 3SD Volume Segmentation
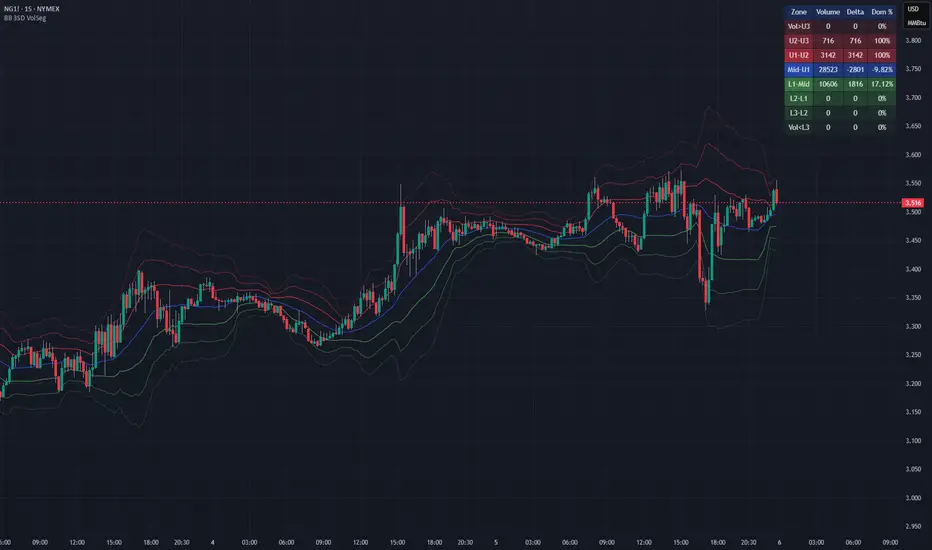
Purpose
This script provides a structured way to analyze how real traded volume distributes across the different volatility zones defined by Bollinger Bands with three standard deviations, it reveals where activity concentrates, how pressure shifts between buyers and sellers, and how market participation behaves as price moves through expanding or contracting volatility regimes. The tool turns the bands into a mechanical segmentation system that exposes the microstructure hidden inside each volatility layer.
How it works
The script calculates Bollinger Bands at one, two, and three standard deviations, then assigns every bar’s volume to the correct volatility zone based on where price closed, it reconstructs buy and sell volume from candle behavior, computes delta as the difference between them, and aggregates these values over the chosen lookback window. Each zone displays total volume, delta, and a dominance percentage that expresses how strongly buyers or sellers controlled that region, all updated dynamically on the most recent bar. For example, if the Mid–U1 zone shows 28,450 contracts with a –2,728 delta and –9.59% dominance, that indicates mild seller control in a normally balanced rotation area, while the L1–Mid zone showing 10,606 contracts, +1,816 delta, and 17.12% dominance signals buyers absorbing pressure and defending the pullback.
Rationale
Volatility zones behave like natural boundaries where liquidity concentrates, where traders commit, hesitate, or get trapped, and where expansions or reversals often originate, so segmenting volume and delta by these zones provides a clearer picture of intent and pressure than raw volume alone. By quantifying how much buying or selling occurred in each volatility layer, the script helps identify continuation, absorption, exhaustion, and imbalance, giving traders a mechanical, objective map of market behavior rather than relying on subjective interpretation.
This script provides a structured way to analyze how real traded volume distributes across the different volatility zones defined by Bollinger Bands with three standard deviations, it reveals where activity concentrates, how pressure shifts between buyers and sellers, and how market participation behaves as price moves through expanding or contracting volatility regimes. The tool turns the bands into a mechanical segmentation system that exposes the microstructure hidden inside each volatility layer.
How it works
The script calculates Bollinger Bands at one, two, and three standard deviations, then assigns every bar’s volume to the correct volatility zone based on where price closed, it reconstructs buy and sell volume from candle behavior, computes delta as the difference between them, and aggregates these values over the chosen lookback window. Each zone displays total volume, delta, and a dominance percentage that expresses how strongly buyers or sellers controlled that region, all updated dynamically on the most recent bar. For example, if the Mid–U1 zone shows 28,450 contracts with a –2,728 delta and –9.59% dominance, that indicates mild seller control in a normally balanced rotation area, while the L1–Mid zone showing 10,606 contracts, +1,816 delta, and 17.12% dominance signals buyers absorbing pressure and defending the pullback.
Rationale
Volatility zones behave like natural boundaries where liquidity concentrates, where traders commit, hesitate, or get trapped, and where expansions or reversals often originate, so segmenting volume and delta by these zones provides a clearer picture of intent and pressure than raw volume alone. By quantifying how much buying or selling occurred in each volatility layer, the script helps identify continuation, absorption, exhaustion, and imbalance, giving traders a mechanical, objective map of market behavior rather than relying on subjective interpretation.
릴리즈 노트
- Removed obsolete inputs릴리즈 노트
- Added Volume% column and highlight for the most active SD band오픈 소스 스크립트
트레이딩뷰의 진정한 정신에 따라, 이 스크립트의 작성자는 이를 오픈소스로 공개하여 트레이더들이 기능을 검토하고 검증할 수 있도록 했습니다. 작성자에게 찬사를 보냅니다! 이 코드는 무료로 사용할 수 있지만, 코드를 재게시하는 경우 하우스 룰이 적용된다는 점을 기억하세요.

면책사항
해당 정보와 게시물은 금융, 투자, 트레이딩 또는 기타 유형의 조언이나 권장 사항으로 간주되지 않으며, 트레이딩뷰에서 제공하거나 보증하는 것이 아닙니다. 자세한 내용은 이용 약관을 참조하세요.
오픈 소스 스크립트
트레이딩뷰의 진정한 정신에 따라, 이 스크립트의 작성자는 이를 오픈소스로 공개하여 트레이더들이 기능을 검토하고 검증할 수 있도록 했습니다. 작성자에게 찬사를 보냅니다! 이 코드는 무료로 사용할 수 있지만, 코드를 재게시하는 경우 하우스 룰이 적용된다는 점을 기억하세요.
면책사항
해당 정보와 게시물은 금융, 투자, 트레이딩 또는 기타 유형의 조언이나 권장 사항으로 간주되지 않으며, 트레이딩뷰에서 제공하거나 보증하는 것이 아닙니다. 자세한 내용은 이용 약관을 참조하세요.