OPEN-SOURCE SCRIPT
Range Ninja
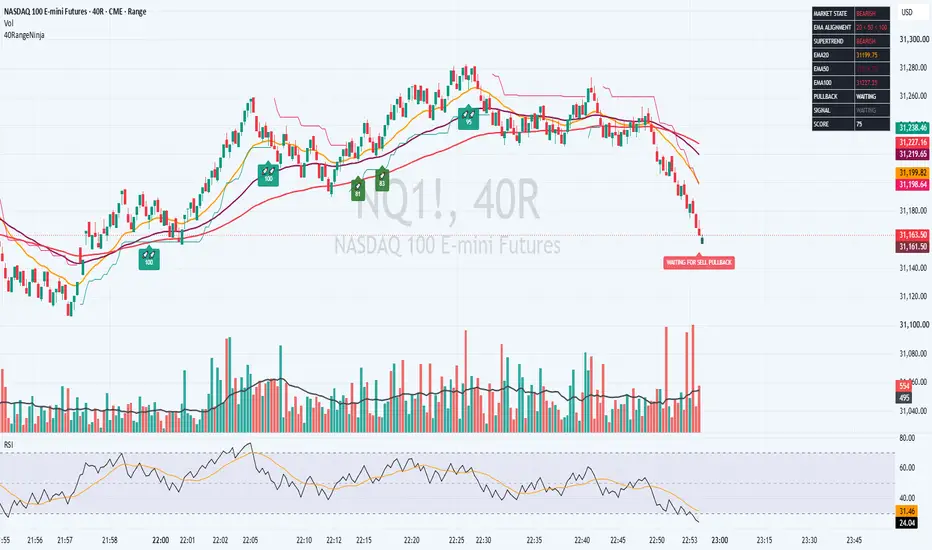
RANGE NINJA — EMA20 Pullback & Rejection Signals
Range Ninja finds trend-following entries. It waits for a strong trend, waits for price to pull back to the orange EMA 20 line, and only signals when the candle bounces off that line.
Built mainly for SCALPING NQ (Nasdaq futures) on a Range chart such as 40R. It works on any chart type and timeframe, but only NQ 40R is the intended setup. For other markets or range sizes, please test it yourself first.
━━━━━━━━━━━━━━━━━━━━
KEY POINTS (READ THIS FIRST)
━━━━━━━━━━━━━━━━━━━━
- Best suited for scalpers trading NQ on a 40R Range chart.
- Other instruments and chart types: not tested by the author. Test on your own before relying on it.
- Combine it with a 5-minute candle chart for more context. Use the 5-minute chart to see the bigger trend and key levels, and use Range Ninja on the 40R chart to time the entry. Trading in the same direction as the 5-minute trend usually gives cleaner setups.
- Scalping target idea: many traders aim for about 20-30 ticks. On NQ, 1 tick = 0.25 points, so 20-30 ticks = 5 to 7.5 points. This is only a common idea, not a promise. Set your own target, stop loss and risk.
- Be patient. The indicator is quiet on purpose. Wait for the full setup: trend, pullback to EMA 20, then rejection candle. Do not force trades when the dashboard says NEUTRAL or TANGLED.
- Quality over quantity. A few good setups are better than many weak ones.
━━━━━━━━━━━━━━━━━━━━
HOW IT WORKS (3 STEPS)
━━━━━━━━━━━━━━━━━━━━
1. TREND: The EMAs must be lined up and Supertrend must agree.
- Uptrend: EMA 20 > EMA 50 > EMA 100 and Supertrend is bullish
- Downtrend: EMA 20 < EMA 50 < EMA 100 and Supertrend is bearish
2. PULLBACK: Price comes back and touches (or slightly pierces) the EMA 20.
3. REJECTION: The candle bounces away from the EMA 20 and closes in the trend direction.
If any step is missing, there is no signal. This is not an EMA crossover indicator, and it avoids chasing price when it is far from the EMA 20.
━━━━━━━━━━━━━━━━━━━━
HOW TO READ THE CHART
━━━━━━━━━━━━━━━━━━━━
🚀 = BUY signal (score shown inside the box)
🚀🚀 = STRONG BUY (the candle looks like a hammer)
🚨 = SELL signal
🚨🚨 = STRONG SELL (the candle looks like a shooting star)
The number inside the box is the signal score from 0 to 100. A higher score means the setup matches more of the rules. By default, only signals scoring 70 or higher are shown.
Lines on the chart:
- Orange = EMA 20
- Maroon = EMA 50
- Red = EMA 100
- Green / pink line = Supertrend
━━━━━━━━━━━━━━━━━━━━
THE DASHBOARD (top right)
━━━━━━━━━━━━━━━━━━━━
- MARKET STATE: Bullish, Bearish or Neutral
- EMA ALIGNMENT: shows whether the EMAs are lined up or "TANGLED"
- SUPERTREND: current direction
- EMA20 / EMA50 / EMA100: current values
- PULLBACK: WAITING, TESTING EMA20 or REJECTED
- SIGNAL and SCORE: the latest result
Tip: if the table says NEUTRAL or TANGLED, the market has no clear trend. The indicator stays quiet on purpose.
━━━━━━━━━━━━━━━━━━━━
HOW TO USE IT
━━━━━━━━━━━━━━━━━━━━
1. Open NQ on a 40R Range chart and add the indicator.
2. Check the 5-minute candle chart for the main direction.
3. Wait for the 40R dashboard to show a clear trend (BULLISH or BEARISH) in the same direction.
4. Wait for price to pull back to the orange EMA 20 line. Be patient.
5. Take action only when a signal box appears. Signals appear only after the candle closes (default setting), so they do not disappear or move.
6. Use your own entry, stop loss and risk rules. A common idea is to place the stop beyond the rejection candle's wick.
7. Treat a STRONG signal or a high score as extra confirmation, not a guarantee.
━━━━━━━━━━━━━━━━━━━━
MAIN SETTINGS
━━━━━━━━━━━━━━━━━━━━
EMAs: change the lengths (default 20 / 50 / 100). Optional: require all EMAs to slope in the trend direction.
Supertrend: ATR length 10, factor 3.0 (both adjustable).
Min EMA separation: ignores setups where the EMAs are squeezed together.
EMA20 touch tolerance / max penetration: how close price must get to the EMA 20, and how far through it is still acceptable.
Candle rules: minimum body size, minimum wick size, and the hammer / shooting-star shape.
Minimum signal score: default 70. Raise it for fewer, higher-quality signals.
Min bars between signals: stops repeated signals on neighbouring candles.
Signal only on candle close: ON by default (recommended, no repainting).
Signal symbols: change the emoji, the box colours, the size and the distance from the candle.
Dashboard: show or hide it, and change its position and text size.
Most distances are measured in ATR, so the settings adapt automatically when you change the Range size or the instrument.
━━━━━━━━━━━━━━━━━━━━
TOO MANY SIGNALS?
━━━━━━━━━━━━━━━━━━━━
- Raise the minimum score to 75-80
- Increase the minimum EMA separation
- Turn on EMA slope confirmation
- Lower the touch tolerance
- Increase the bars between signals
TOO FEW SIGNALS?
━━━━━━━━━━━━━━━━━━━━
- Lower the minimum score to 60-65
- Lower the minimum wick size
- Increase the touch tolerance
- Turn off "Previous bar must close on trend side"
- Lower the minimum EMA separation
━━━━━━━━━━━━━━━━━━━━
ALERTS
━━━━━━━━━━━━━━━━━━━━
Create an alert and choose one of: BUY SETUP, STRONG BUY, SELL SETUP, STRONG SELL, BUY CONFIRMED, SELL CONFIRMED.
To get the score in the alert message, turn on "Enable dynamic alert() messages" in the settings, then create the alert with "Any alert() function call".
━━━━━━━━━━━━━━━━━━━━
GOOD TO KNOW
━━━━━━━━━━━━━━━━━━━━
- No signals in sideways or tangled markets, by design.
- Signals use only the current and past candles. There is no lookahead.
- Works best in clear trends. Quality matters more than quantity.
- Always test on a demo account or replay mode before using real money.
━━━━━━━━━━━━━━━━━━━━
DISCLAIMER
━━━━━━━━━━━━━━━━━━━━
This indicator is for educational and informational purposes only. It is not financial advice and does not guarantee profits. Trading futures and other markets involves a high risk of loss. Past performance does not predict future results. You are responsible for your own trading decisions.
Range Ninja finds trend-following entries. It waits for a strong trend, waits for price to pull back to the orange EMA 20 line, and only signals when the candle bounces off that line.
Built mainly for SCALPING NQ (Nasdaq futures) on a Range chart such as 40R. It works on any chart type and timeframe, but only NQ 40R is the intended setup. For other markets or range sizes, please test it yourself first.
━━━━━━━━━━━━━━━━━━━━
KEY POINTS (READ THIS FIRST)
━━━━━━━━━━━━━━━━━━━━
- Best suited for scalpers trading NQ on a 40R Range chart.
- Other instruments and chart types: not tested by the author. Test on your own before relying on it.
- Combine it with a 5-minute candle chart for more context. Use the 5-minute chart to see the bigger trend and key levels, and use Range Ninja on the 40R chart to time the entry. Trading in the same direction as the 5-minute trend usually gives cleaner setups.
- Scalping target idea: many traders aim for about 20-30 ticks. On NQ, 1 tick = 0.25 points, so 20-30 ticks = 5 to 7.5 points. This is only a common idea, not a promise. Set your own target, stop loss and risk.
- Be patient. The indicator is quiet on purpose. Wait for the full setup: trend, pullback to EMA 20, then rejection candle. Do not force trades when the dashboard says NEUTRAL or TANGLED.
- Quality over quantity. A few good setups are better than many weak ones.
━━━━━━━━━━━━━━━━━━━━
HOW IT WORKS (3 STEPS)
━━━━━━━━━━━━━━━━━━━━
1. TREND: The EMAs must be lined up and Supertrend must agree.
- Uptrend: EMA 20 > EMA 50 > EMA 100 and Supertrend is bullish
- Downtrend: EMA 20 < EMA 50 < EMA 100 and Supertrend is bearish
2. PULLBACK: Price comes back and touches (or slightly pierces) the EMA 20.
3. REJECTION: The candle bounces away from the EMA 20 and closes in the trend direction.
If any step is missing, there is no signal. This is not an EMA crossover indicator, and it avoids chasing price when it is far from the EMA 20.
━━━━━━━━━━━━━━━━━━━━
HOW TO READ THE CHART
━━━━━━━━━━━━━━━━━━━━
🚀 = BUY signal (score shown inside the box)
🚀🚀 = STRONG BUY (the candle looks like a hammer)
🚨 = SELL signal
🚨🚨 = STRONG SELL (the candle looks like a shooting star)
The number inside the box is the signal score from 0 to 100. A higher score means the setup matches more of the rules. By default, only signals scoring 70 or higher are shown.
Lines on the chart:
- Orange = EMA 20
- Maroon = EMA 50
- Red = EMA 100
- Green / pink line = Supertrend
━━━━━━━━━━━━━━━━━━━━
THE DASHBOARD (top right)
━━━━━━━━━━━━━━━━━━━━
- MARKET STATE: Bullish, Bearish or Neutral
- EMA ALIGNMENT: shows whether the EMAs are lined up or "TANGLED"
- SUPERTREND: current direction
- EMA20 / EMA50 / EMA100: current values
- PULLBACK: WAITING, TESTING EMA20 or REJECTED
- SIGNAL and SCORE: the latest result
Tip: if the table says NEUTRAL or TANGLED, the market has no clear trend. The indicator stays quiet on purpose.
━━━━━━━━━━━━━━━━━━━━
HOW TO USE IT
━━━━━━━━━━━━━━━━━━━━
1. Open NQ on a 40R Range chart and add the indicator.
2. Check the 5-minute candle chart for the main direction.
3. Wait for the 40R dashboard to show a clear trend (BULLISH or BEARISH) in the same direction.
4. Wait for price to pull back to the orange EMA 20 line. Be patient.
5. Take action only when a signal box appears. Signals appear only after the candle closes (default setting), so they do not disappear or move.
6. Use your own entry, stop loss and risk rules. A common idea is to place the stop beyond the rejection candle's wick.
7. Treat a STRONG signal or a high score as extra confirmation, not a guarantee.
━━━━━━━━━━━━━━━━━━━━
MAIN SETTINGS
━━━━━━━━━━━━━━━━━━━━
EMAs: change the lengths (default 20 / 50 / 100). Optional: require all EMAs to slope in the trend direction.
Supertrend: ATR length 10, factor 3.0 (both adjustable).
Min EMA separation: ignores setups where the EMAs are squeezed together.
EMA20 touch tolerance / max penetration: how close price must get to the EMA 20, and how far through it is still acceptable.
Candle rules: minimum body size, minimum wick size, and the hammer / shooting-star shape.
Minimum signal score: default 70. Raise it for fewer, higher-quality signals.
Min bars between signals: stops repeated signals on neighbouring candles.
Signal only on candle close: ON by default (recommended, no repainting).
Signal symbols: change the emoji, the box colours, the size and the distance from the candle.
Dashboard: show or hide it, and change its position and text size.
Most distances are measured in ATR, so the settings adapt automatically when you change the Range size or the instrument.
━━━━━━━━━━━━━━━━━━━━
TOO MANY SIGNALS?
━━━━━━━━━━━━━━━━━━━━
- Raise the minimum score to 75-80
- Increase the minimum EMA separation
- Turn on EMA slope confirmation
- Lower the touch tolerance
- Increase the bars between signals
TOO FEW SIGNALS?
━━━━━━━━━━━━━━━━━━━━
- Lower the minimum score to 60-65
- Lower the minimum wick size
- Increase the touch tolerance
- Turn off "Previous bar must close on trend side"
- Lower the minimum EMA separation
━━━━━━━━━━━━━━━━━━━━
ALERTS
━━━━━━━━━━━━━━━━━━━━
Create an alert and choose one of: BUY SETUP, STRONG BUY, SELL SETUP, STRONG SELL, BUY CONFIRMED, SELL CONFIRMED.
To get the score in the alert message, turn on "Enable dynamic alert() messages" in the settings, then create the alert with "Any alert() function call".
━━━━━━━━━━━━━━━━━━━━
GOOD TO KNOW
━━━━━━━━━━━━━━━━━━━━
- No signals in sideways or tangled markets, by design.
- Signals use only the current and past candles. There is no lookahead.
- Works best in clear trends. Quality matters more than quantity.
- Always test on a demo account or replay mode before using real money.
━━━━━━━━━━━━━━━━━━━━
DISCLAIMER
━━━━━━━━━━━━━━━━━━━━
This indicator is for educational and informational purposes only. It is not financial advice and does not guarantee profits. Trading futures and other markets involves a high risk of loss. Past performance does not predict future results. You are responsible for your own trading decisions.
오픈 소스 스크립트
트레이딩뷰의 진정한 정신에 따라, 이 스크립트의 작성자는 이를 오픈소스로 공개하여 트레이더들이 기능을 검토하고 검증할 수 있도록 했습니다. 작성자에게 찬사를 보냅니다! 이 코드는 무료로 사용할 수 있지만, 코드를 재게시하는 경우 하우스 룰이 적용된다는 점을 기억하세요.

면책사항
해당 정보와 게시물은 금융, 투자, 트레이딩 또는 기타 유형의 조언이나 권장 사항으로 간주되지 않으며, 트레이딩뷰에서 제공하거나 보증하는 것이 아닙니다. 자세한 내용은 이용 약관을 참조하세요.
오픈 소스 스크립트
트레이딩뷰의 진정한 정신에 따라, 이 스크립트의 작성자는 이를 오픈소스로 공개하여 트레이더들이 기능을 검토하고 검증할 수 있도록 했습니다. 작성자에게 찬사를 보냅니다! 이 코드는 무료로 사용할 수 있지만, 코드를 재게시하는 경우 하우스 룰이 적용된다는 점을 기억하세요.
면책사항
해당 정보와 게시물은 금융, 투자, 트레이딩 또는 기타 유형의 조언이나 권장 사항으로 간주되지 않으며, 트레이딩뷰에서 제공하거나 보증하는 것이 아닙니다. 자세한 내용은 이용 약관을 참조하세요.