OPEN-SOURCE SCRIPT
SMA Strategy
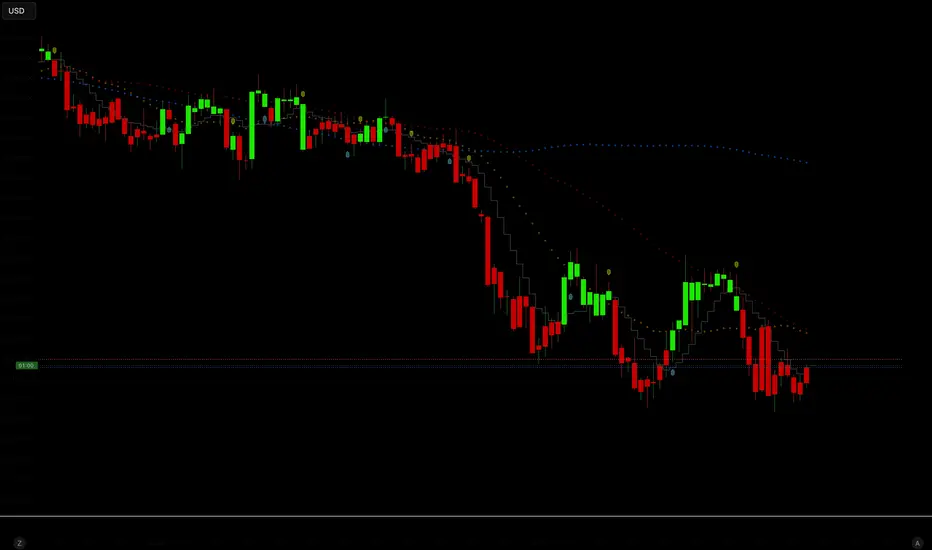
SMA Strategy is a minimalist trend-following trading system built around the interaction of short-term Simple Moving Averages.
The strategy uses the crossover between the SMA 5 and SMA 9 as the primary market trigger, while the SMA 20, SMA 50, and SMA 200 provide additional visual context for short-, medium-, and long-term trend structure.
Core Logic:
A LONG position is opened when the SMA 5 crosses above SMA 9.
A SHORT position is opened when the SMA 5 crosses below SMA 9.
Risk Management
Each trade automatically calculates:
a Stop Loss based on the most recent market structure,
and a Take Profit using a fixed 2:1 risk-to-reward ratio.
For long positions:
Stop Loss = lowest low of the last 5 candles.
Take Profit = entry price + 2× risk.
For short positions:
Stop Loss = highest high of the last 5 candles.
Take Profit = entry price − 2× risk.
This dynamic approach allows the strategy to adapt naturally to changing volatility and price structure.
Visual Features
The script includes multiple visual layers for quick chart interpretation:
SMA 9 displayed as a stepline trigger line.
SMA 20, SMA 50, and SMA 200 plotted as soft circular overlays.
Buy and sell signals plotted directly on the chart.
Candle colors change according to the direction of the SMA 9 trend:
Green candles indicate bullish momentum.
Red candles indicate bearish momentum.
Purpose
The strategy is designed for:
trend continuation trading, short-term momentum detection and clean visual market structure analysis.
Its lightweight construction makes it suitable for discretionary traders, automated backtesting, and further system development.
The strategy uses the crossover between the SMA 5 and SMA 9 as the primary market trigger, while the SMA 20, SMA 50, and SMA 200 provide additional visual context for short-, medium-, and long-term trend structure.
Core Logic:
A LONG position is opened when the SMA 5 crosses above SMA 9.
A SHORT position is opened when the SMA 5 crosses below SMA 9.
Risk Management
Each trade automatically calculates:
a Stop Loss based on the most recent market structure,
and a Take Profit using a fixed 2:1 risk-to-reward ratio.
For long positions:
Stop Loss = lowest low of the last 5 candles.
Take Profit = entry price + 2× risk.
For short positions:
Stop Loss = highest high of the last 5 candles.
Take Profit = entry price − 2× risk.
This dynamic approach allows the strategy to adapt naturally to changing volatility and price structure.
Visual Features
The script includes multiple visual layers for quick chart interpretation:
SMA 9 displayed as a stepline trigger line.
SMA 20, SMA 50, and SMA 200 plotted as soft circular overlays.
Buy and sell signals plotted directly on the chart.
Candle colors change according to the direction of the SMA 9 trend:
Green candles indicate bullish momentum.
Red candles indicate bearish momentum.
Purpose
The strategy is designed for:
trend continuation trading, short-term momentum detection and clean visual market structure analysis.
Its lightweight construction makes it suitable for discretionary traders, automated backtesting, and further system development.
오픈 소스 스크립트
트레이딩뷰의 진정한 정신에 따라, 이 스크립트의 작성자는 이를 오픈소스로 공개하여 트레이더들이 기능을 검토하고 검증할 수 있도록 했습니다. 작성자에게 찬사를 보냅니다! 이 코드는 무료로 사용할 수 있지만, 코드를 재게시하는 경우 하우스 룰이 적용된다는 점을 기억하세요.

면책사항
해당 정보와 게시물은 금융, 투자, 트레이딩 또는 기타 유형의 조언이나 권장 사항으로 간주되지 않으며, 트레이딩뷰에서 제공하거나 보증하는 것이 아닙니다. 자세한 내용은 이용 약관을 참조하세요.
오픈 소스 스크립트
트레이딩뷰의 진정한 정신에 따라, 이 스크립트의 작성자는 이를 오픈소스로 공개하여 트레이더들이 기능을 검토하고 검증할 수 있도록 했습니다. 작성자에게 찬사를 보냅니다! 이 코드는 무료로 사용할 수 있지만, 코드를 재게시하는 경우 하우스 룰이 적용된다는 점을 기억하세요.
면책사항
해당 정보와 게시물은 금융, 투자, 트레이딩 또는 기타 유형의 조언이나 권장 사항으로 간주되지 않으며, 트레이딩뷰에서 제공하거나 보증하는 것이 아닙니다. 자세한 내용은 이용 약관을 참조하세요.