OPEN-SOURCE SCRIPT
Cross-Platform Price Offset Dashboard
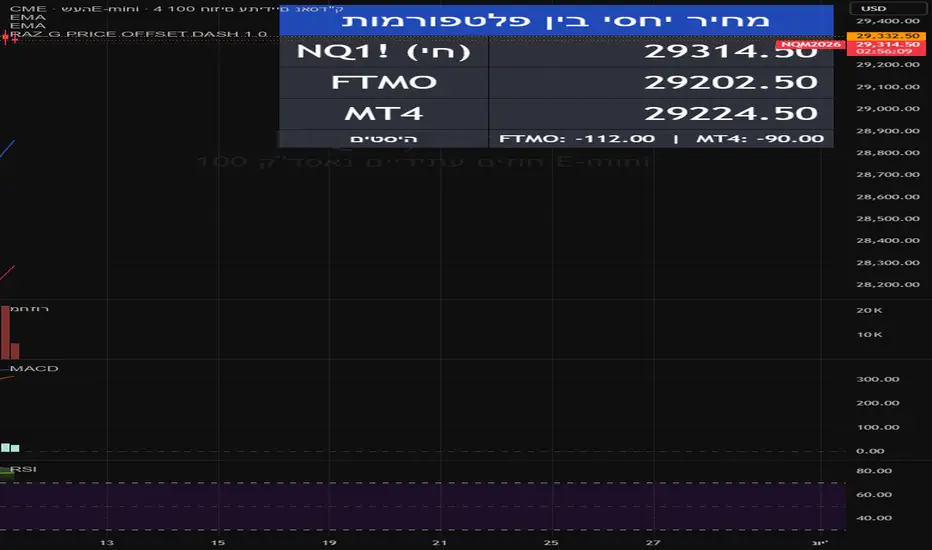
## What it does
A utility dashboard for traders who hold accounts across multiple brokers
or trading platforms where the same underlying instrument quotes at slightly
different prices. The indicator displays, in real time, the equivalent
price of the chart's symbol on up to two external platforms — based on a
fixed offset that you calibrate once, manually.
## Why this exists
Traders who route the same idea to several brokers often see small but
persistent price gaps between platforms: different contract specifications,
broker-specific spreads, rollover timing differences between data feeds,
or CFD-versus-futures pricing on the same underlying. When you mark a
level on TradingView (entry, stop, target), you still need to translate
that level into the price scale of the platform where the trade is
actually executed. This indicator removes that mental arithmetic.
## How it works
At a single moment of your choosing, you take a simultaneous snapshot of
three values:
1. The current price of the symbol on the TradingView chart.
2. The price of the same instrument on Platform 1 (for example, your
live MT4 or MT5 account).
3. The price of the same instrument on Platform 2 (another broker or
account).
You enter all three values into the indicator's inputs. From that
moment on, the indicator computes a constant offset for each platform:
offset_1 = platform_1_price − reference_price
offset_2 = platform_2_price − reference_price
It then displays the live equivalent on each platform as:
platform_1_live = close + offset_1
platform_2_live = close + offset_2
If the TradingView chart moves +20 points, the displayed prices for both
platforms also move +20 points relative to their calibrated baseline.
## How to use
1. Add the indicator to any chart. It is symbol-agnostic and works on
futures, indices, metals, stocks, and crypto.
2. Open the indicator settings, "Calibration" tab.
3. Fill in the three calibration prices, all taken at the same moment
from your platforms.
4. Optionally, rename "Platform 1" and "Platform 2" to your broker names.
5. The dashboard now updates on every tick.
## Inputs
- Reference price at calibration — the chart's price at the moment you
took the snapshot.
- Platform 1 name / Platform 2 name — labels shown in the table.
- Platform 1 price / Platform 2 price at calibration — the corresponding
prices on your external platforms at that same moment.
- Display options — table position, text size (tiny, small, normal,
large, huge), text and background colors, and an optional row that
shows the raw offsets for sanity-checking.
## Assumptions and limitations
- The offset is treated as constant until you recalibrate. If the broker
changes the spread, rolls a contract, or shifts a data-feed timing,
the displayed values will drift away from reality and you should
recalibrate.
- This is a display utility. It does not place orders, generate signals,
or connect to any external broker. All three calibration prices are
entered manually by the user.
- Recalibration is manual. Whenever you observe a meaningful drift on
your real platform, take a fresh snapshot and update the three input
values.
## Notes
- The indicator does not connect to brokers, does not fetch external
data, and does not access any network resource. It operates purely on
the chart's close series and on the three calibration inputs you
provide.
- Displayed prices use the chart symbol's mintick precision, so values
appear at the same precision as your chart.
- The source is fully open. Read the code for the exact formula and the
table-rendering logic.
This script is provided for informational and convenience purposes only
and does not constitute trading advice.
A utility dashboard for traders who hold accounts across multiple brokers
or trading platforms where the same underlying instrument quotes at slightly
different prices. The indicator displays, in real time, the equivalent
price of the chart's symbol on up to two external platforms — based on a
fixed offset that you calibrate once, manually.
## Why this exists
Traders who route the same idea to several brokers often see small but
persistent price gaps between platforms: different contract specifications,
broker-specific spreads, rollover timing differences between data feeds,
or CFD-versus-futures pricing on the same underlying. When you mark a
level on TradingView (entry, stop, target), you still need to translate
that level into the price scale of the platform where the trade is
actually executed. This indicator removes that mental arithmetic.
## How it works
At a single moment of your choosing, you take a simultaneous snapshot of
three values:
1. The current price of the symbol on the TradingView chart.
2. The price of the same instrument on Platform 1 (for example, your
live MT4 or MT5 account).
3. The price of the same instrument on Platform 2 (another broker or
account).
You enter all three values into the indicator's inputs. From that
moment on, the indicator computes a constant offset for each platform:
offset_1 = platform_1_price − reference_price
offset_2 = platform_2_price − reference_price
It then displays the live equivalent on each platform as:
platform_1_live = close + offset_1
platform_2_live = close + offset_2
If the TradingView chart moves +20 points, the displayed prices for both
platforms also move +20 points relative to their calibrated baseline.
## How to use
1. Add the indicator to any chart. It is symbol-agnostic and works on
futures, indices, metals, stocks, and crypto.
2. Open the indicator settings, "Calibration" tab.
3. Fill in the three calibration prices, all taken at the same moment
from your platforms.
4. Optionally, rename "Platform 1" and "Platform 2" to your broker names.
5. The dashboard now updates on every tick.
## Inputs
- Reference price at calibration — the chart's price at the moment you
took the snapshot.
- Platform 1 name / Platform 2 name — labels shown in the table.
- Platform 1 price / Platform 2 price at calibration — the corresponding
prices on your external platforms at that same moment.
- Display options — table position, text size (tiny, small, normal,
large, huge), text and background colors, and an optional row that
shows the raw offsets for sanity-checking.
## Assumptions and limitations
- The offset is treated as constant until you recalibrate. If the broker
changes the spread, rolls a contract, or shifts a data-feed timing,
the displayed values will drift away from reality and you should
recalibrate.
- This is a display utility. It does not place orders, generate signals,
or connect to any external broker. All three calibration prices are
entered manually by the user.
- Recalibration is manual. Whenever you observe a meaningful drift on
your real platform, take a fresh snapshot and update the three input
values.
## Notes
- The indicator does not connect to brokers, does not fetch external
data, and does not access any network resource. It operates purely on
the chart's close series and on the three calibration inputs you
provide.
- Displayed prices use the chart symbol's mintick precision, so values
appear at the same precision as your chart.
- The source is fully open. Read the code for the exact formula and the
table-rendering logic.
This script is provided for informational and convenience purposes only
and does not constitute trading advice.
오픈 소스 스크립트
트레이딩뷰의 진정한 정신에 따라, 이 스크립트의 작성자는 이를 오픈소스로 공개하여 트레이더들이 기능을 검토하고 검증할 수 있도록 했습니다. 작성자에게 찬사를 보냅니다! 이 코드는 무료로 사용할 수 있지만, 코드를 재게시하는 경우 하우스 룰이 적용된다는 점을 기억하세요.

면책사항
해당 정보와 게시물은 금융, 투자, 트레이딩 또는 기타 유형의 조언이나 권장 사항으로 간주되지 않으며, 트레이딩뷰에서 제공하거나 보증하는 것이 아닙니다. 자세한 내용은 이용 약관을 참조하세요.
오픈 소스 스크립트
트레이딩뷰의 진정한 정신에 따라, 이 스크립트의 작성자는 이를 오픈소스로 공개하여 트레이더들이 기능을 검토하고 검증할 수 있도록 했습니다. 작성자에게 찬사를 보냅니다! 이 코드는 무료로 사용할 수 있지만, 코드를 재게시하는 경우 하우스 룰이 적용된다는 점을 기억하세요.
면책사항
해당 정보와 게시물은 금융, 투자, 트레이딩 또는 기타 유형의 조언이나 권장 사항으로 간주되지 않으며, 트레이딩뷰에서 제공하거나 보증하는 것이 아닙니다. 자세한 내용은 이용 약관을 참조하세요.