OPEN-SOURCE SCRIPT
ED by bigmm
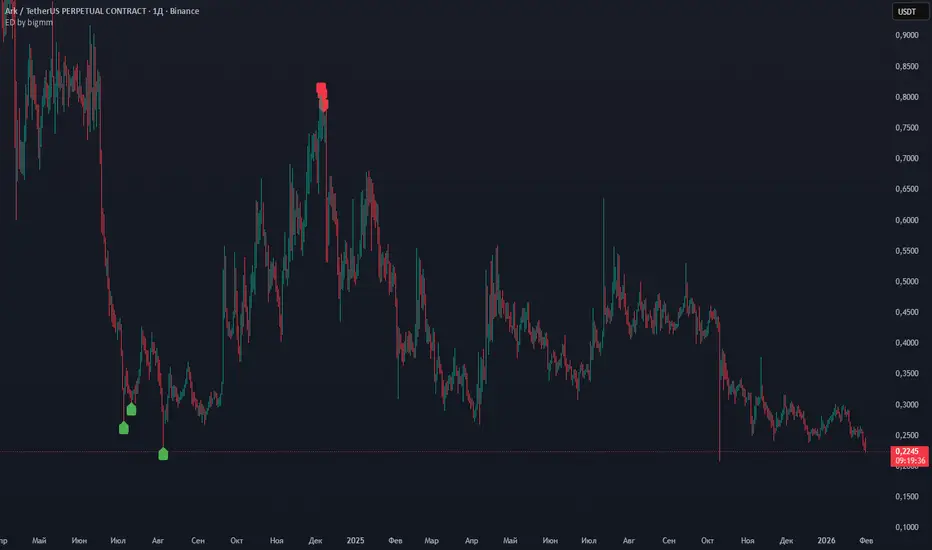
ED by bigmm identifies significant price divergences from the 200-period Exponential Moving Average (EMA) by analyzing closing and opening price extremes. This tool marks the three most recent candles with the largest percentage deviations.
Key Features
Recommended Usage
Best used on higher timeframes (H4, D1, W1) for the following reasons:
Key Features
- EMA200 Analysis: Uses the 200-period Exponential Moving Average as the primary reference level for measuring price deviations
- Deviation Calculation: Computes percentage-based deviations for both closing (below EMA) and opening (above EMA) prices
- Top 3 Extremes: Identifies and marks only the three most recent maximum deviations for each direction
- Visual Simplicity: Uses minimalistic green and red dots for clear visual identification without chart clutter
- Historical Analysis: Evaluates the last 1440 bars (approximately 3 years on daily timeframe) to find significant deviation patterns
Recommended Usage
Best used on higher timeframes (H4, D1, W1) for the following reasons:
- Reduced Noise: Higher timeframes filter out market noise and provide cleaner deviation signals
- Trend Context: EMA200 carries more significance on daily and weekly charts as a major trend indicator
- Strategic Signals: Extreme deviations on higher timeframes often correspond to important support/resistance levels and potential reversal zones
- Reduced False Signals: Longer timeframes minimize whipsaws and provide more reliable extreme readings
- Position Trading: Ideal for swing traders and position traders who base decisions on daily or weekly price action
오픈 소스 스크립트
트레이딩뷰의 진정한 정신에 따라, 이 스크립트의 작성자는 이를 오픈소스로 공개하여 트레이더들이 기능을 검토하고 검증할 수 있도록 했습니다. 작성자에게 찬사를 보냅니다! 이 코드는 무료로 사용할 수 있지만, 코드를 재게시하는 경우 하우스 룰이 적용된다는 점을 기억하세요.

Bigmm Trading System (BTS) - это прибыльная система торговли по нескольким торговым стратегиям (TC).
Каждая ТС включает в себя работу с приватными индикаторами by bigmm.
Доступ и внедрение торговых стратегий платный.
Каждая ТС включает в себя работу с приватными индикаторами by bigmm.
Доступ и внедрение торговых стратегий платный.
면책사항
해당 정보와 게시물은 금융, 투자, 트레이딩 또는 기타 유형의 조언이나 권장 사항으로 간주되지 않으며, 트레이딩뷰에서 제공하거나 보증하는 것이 아닙니다. 자세한 내용은 이용 약관을 참조하세요.
오픈 소스 스크립트
트레이딩뷰의 진정한 정신에 따라, 이 스크립트의 작성자는 이를 오픈소스로 공개하여 트레이더들이 기능을 검토하고 검증할 수 있도록 했습니다. 작성자에게 찬사를 보냅니다! 이 코드는 무료로 사용할 수 있지만, 코드를 재게시하는 경우 하우스 룰이 적용된다는 점을 기억하세요.
Bigmm Trading System (BTS) - это прибыльная система торговли по нескольким торговым стратегиям (TC).
Каждая ТС включает в себя работу с приватными индикаторами by bigmm.
Доступ и внедрение торговых стратегий платный.
Каждая ТС включает в себя работу с приватными индикаторами by bigmm.
Доступ и внедрение торговых стратегий платный.
면책사항
해당 정보와 게시물은 금융, 투자, 트레이딩 또는 기타 유형의 조언이나 권장 사항으로 간주되지 않으며, 트레이딩뷰에서 제공하거나 보증하는 것이 아닙니다. 자세한 내용은 이용 약관을 참조하세요.