OPEN-SOURCE SCRIPT
Luminous Volume Flow & Breakout Matrix [Pineify]
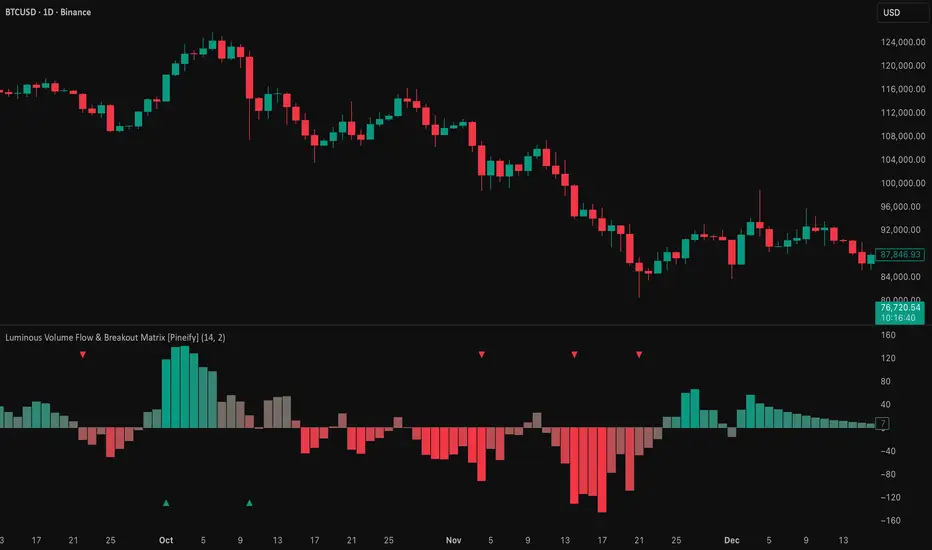
Luminous Volume Flow & Breakout Matrix [Pineify]
This indicator estimates directional money flow by splitting each bar's volume proportionally between buyers and sellers based on where price closed within its range. A close near the high attributes most volume to buying pressure; a close near the low attributes it to selling. The smoothed net delta becomes a volume momentum oscillator, while a separate statistical layer flags volume surges — bars where total volume exceeds its recent mean by a configurable number of standard deviations. When a surge aligns with a directional lean, it often marks the kind of institutional event that precedes sustained moves.
Key Features
How It Works
Rather than assigning all of a bar's volume to one side, the calculation uses a proportional model. If a bar's range is 10 points and the close sits 7 points above the low, 70% of volume is attributed to buying pressure and 30% to selling. This produces a continuous volume delta that reflects intrabar conviction with more granularity than binary methods.
How the Components Work Together
The volume delta oscillator and the surge detector answer two different questions. The oscillator reveals direction — whether the prevailing volume is buyer- or seller-dominated. The surge detector reveals magnitude — whether total participation is abnormally high. Neither signal alone is particularly useful: a volume spike in a mixed-delta environment is just noise, and steady directional flow without unusual volume is normal trending behavior.
The indicator combines both by only plotting surge markers when the oscillator confirms direction. A bullish triangle appears when volume exceeds the statistical threshold AND the smoothed delta is positive — meaning the abnormal volume is flowing toward buyers, not just appearing randomly. This two-filter approach reduces false signals from earnings gaps, data releases, or other events that produce big volume without clear directional intent.
Trading Ideas and Insights
The proportional volume split is an approximation, not actual order flow data. Doji bars with small ranges but high volume will split nearly 50/50 regardless of the real buyer/seller composition. On instruments with thin volume or wide spreads, treat the oscillator as directional bias rather than precise measurement.
Unique Aspects
How to Use
Customization
Conclusion
The Luminous Volume Flow & Breakout Matrix combines proportional volume splitting with statistical surge detection to surface moments where unusual volume carries clear directional intent. The oscillator provides continuous context on who controls the tape, while the surge markers highlight outlier events worth paying attention to. Best used as a confirmation layer alongside price structure — volume shows you the conviction behind a move, but not the map.
This indicator estimates directional money flow by splitting each bar's volume proportionally between buyers and sellers based on where price closed within its range. A close near the high attributes most volume to buying pressure; a close near the low attributes it to selling. The smoothed net delta becomes a volume momentum oscillator, while a separate statistical layer flags volume surges — bars where total volume exceeds its recent mean by a configurable number of standard deviations. When a surge aligns with a directional lean, it often marks the kind of institutional event that precedes sustained moves.
Key Features
- Proportional volume splitting — fractional allocation based on close position within the bar's range, not a binary up/down classification
- EMA-smoothed volume delta oscillator with adaptive gradient coloring
- Statistical volume surge detection using a mean + standard deviation threshold
- Surge signals filtered by oscillator direction — bullish surges only fire when net flow is positive, bearish only when negative
How It Works
Rather than assigning all of a bar's volume to one side, the calculation uses a proportional model. If a bar's range is 10 points and the close sits 7 points above the low, 70% of volume is attributed to buying pressure and 30% to selling. This produces a continuous volume delta that reflects intrabar conviction with more granularity than binary methods.
- For each bar, buy volume = (close − low) / (high − low) × volume, and sell volume = (high − close) / (high − low) × volume. Zero-range bars receive zero allocation to avoid division errors
- The raw delta (buy − sell) is smoothed with an EMA to strip out single-bar noise and reveal the underlying volume direction trend
- Independently, the indicator calculates a 20-bar SMA and standard deviation of total volume. Bars exceeding the mean by the configured multiplier times the standard deviation are flagged as surges
- The smoothed delta is normalized over a 50-bar window to a 0–1 range, then mapped to a bear-to-bull color gradient for visual momentum reading
How the Components Work Together
The volume delta oscillator and the surge detector answer two different questions. The oscillator reveals direction — whether the prevailing volume is buyer- or seller-dominated. The surge detector reveals magnitude — whether total participation is abnormally high. Neither signal alone is particularly useful: a volume spike in a mixed-delta environment is just noise, and steady directional flow without unusual volume is normal trending behavior.
The indicator combines both by only plotting surge markers when the oscillator confirms direction. A bullish triangle appears when volume exceeds the statistical threshold AND the smoothed delta is positive — meaning the abnormal volume is flowing toward buyers, not just appearing randomly. This two-filter approach reduces false signals from earnings gaps, data releases, or other events that produce big volume without clear directional intent.
Trading Ideas and Insights
- A bullish surge triangle after a pullback into support may indicate institutional accumulation — the combination of extreme volume and positive delta suggests large buyers absorbing supply at a level they consider favorable
- Clusters of surge signals in the same direction over several bars carry more weight than isolated spikes. A single bar can be a data artifact; three or four surges in a week suggests a structural shift
- When the oscillator gradient fades from deep bull to neutral while price continues higher, consider that the move may be running on fumes — price is advancing but volume conviction is declining
The proportional volume split is an approximation, not actual order flow data. Doji bars with small ranges but high volume will split nearly 50/50 regardless of the real buyer/seller composition. On instruments with thin volume or wide spreads, treat the oscillator as directional bias rather than precise measurement.
Unique Aspects
- Proportional allocation produces a continuous delta spectrum rather than the binary all-or-nothing split many volume indicators use. A bar closing at 60% of its range assigns 60/40, preserving nuance that binary methods discard
- The surge detection is purely statistical — it adapts to the instrument's own volume profile rather than relying on fixed thresholds. A surge on a microcap and a surge on SPY are both defined relative to their own baselines
- Directional filtering of surges means the triangles only appear when both conditions align, making them relatively rare and targeted rather than noisy
How to Use
- Add the indicator to your chart. The colored columns show the smoothed volume delta — above zero means net buying pressure, below zero means net selling
- Watch the gradient intensity: deep, saturated colors indicate strong directional flow within the recent 50-bar context. Fading colors suggest conviction is weakening
- Look for triangle markers at the bottom (bullish surge) or top (bearish surge) of the indicator pane. These flag statistically unusual volume aligned with directional flow
- Adjust the Volume Surge Multiplier higher if you see too many signals — a value of 2.5–3.0 will isolate only the most extreme events
Customization
- Flow Smoothing Length (default: 14) — EMA period for the volume delta. Lower values track fast shifts in buying/selling pressure; higher values produce a smoother oscillator at the cost of 3–5 bars of additional lag
- Volume Surge Multiplier (default: 2.0) — How many standard deviations above the 20-bar volume mean qualifies as a surge. At 2.0, roughly 5% of bars will trigger in normally distributed volume; at 3.0, under 1%
- Bullish / Bearish Flow Color — Set the gradient endpoints for positive and negative volume flow. The gradient interpolates between these based on the oscillator's position within its 50-bar range
Conclusion
The Luminous Volume Flow & Breakout Matrix combines proportional volume splitting with statistical surge detection to surface moments where unusual volume carries clear directional intent. The oscillator provides continuous context on who controls the tape, while the surge markers highlight outlier events worth paying attention to. Best used as a confirmation layer alongside price structure — volume shows you the conviction behind a move, but not the map.
오픈 소스 스크립트
트레이딩뷰의 진정한 정신에 따라, 이 스크립트의 작성자는 이를 오픈소스로 공개하여 트레이더들이 기능을 검토하고 검증할 수 있도록 했습니다. 작성자에게 찬사를 보냅니다! 이 코드는 무료로 사용할 수 있지만, 코드를 재게시하는 경우 하우스 룰이 적용된다는 점을 기억하세요.

🚀🚀🚀 Pineify - pineify.app
Essential Toolkit for Every Trader
- AI Pine Script Generator
- Finance AI Agent
- AI Stock Picker
- Pine Script Visual Editor
- Invited indicators
- Strategy Optimizer
- Trading Journal
- Backtest Report
Essential Toolkit for Every Trader
- AI Pine Script Generator
- Finance AI Agent
- AI Stock Picker
- Pine Script Visual Editor
- Invited indicators
- Strategy Optimizer
- Trading Journal
- Backtest Report
면책사항
해당 정보와 게시물은 금융, 투자, 트레이딩 또는 기타 유형의 조언이나 권장 사항으로 간주되지 않으며, 트레이딩뷰에서 제공하거나 보증하는 것이 아닙니다. 자세한 내용은 이용 약관을 참조하세요.
오픈 소스 스크립트
트레이딩뷰의 진정한 정신에 따라, 이 스크립트의 작성자는 이를 오픈소스로 공개하여 트레이더들이 기능을 검토하고 검증할 수 있도록 했습니다. 작성자에게 찬사를 보냅니다! 이 코드는 무료로 사용할 수 있지만, 코드를 재게시하는 경우 하우스 룰이 적용된다는 점을 기억하세요.
🚀🚀🚀 Pineify - pineify.app
Essential Toolkit for Every Trader
- AI Pine Script Generator
- Finance AI Agent
- AI Stock Picker
- Pine Script Visual Editor
- Invited indicators
- Strategy Optimizer
- Trading Journal
- Backtest Report
Essential Toolkit for Every Trader
- AI Pine Script Generator
- Finance AI Agent
- AI Stock Picker
- Pine Script Visual Editor
- Invited indicators
- Strategy Optimizer
- Trading Journal
- Backtest Report
면책사항
해당 정보와 게시물은 금융, 투자, 트레이딩 또는 기타 유형의 조언이나 권장 사항으로 간주되지 않으며, 트레이딩뷰에서 제공하거나 보증하는 것이 아닙니다. 자세한 내용은 이용 약관을 참조하세요.