OPEN-SOURCE SCRIPT
업데이트됨 Oversold Master
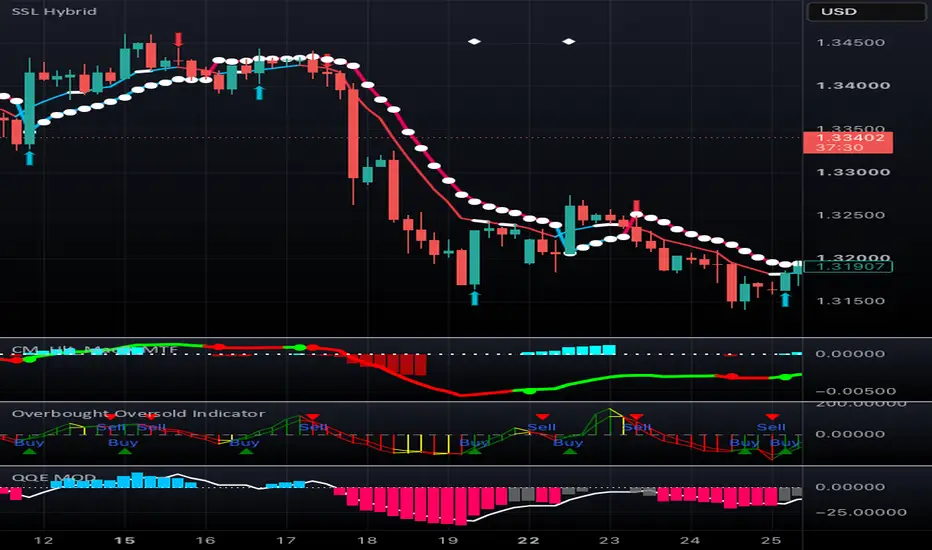
How it works, and how to tune it:
Gray line = neutral. Red = in overbought zone. Blue = in oversold zone.
A triangle signal only appears after price has confirmed its way back out of the zone (controlled by "Bars to Confirm Exit From Zone") — this is what prevents you from selling into a strong momentum spike that keeps climbing.
The bands themselves move (adaptive mode) — during high volatility they widen, so you don't get an overbought signal every 20 minutes; during quiet chop they tighten, so you still catch real extremes.
The trend filter checks a daily EMA by default — it will block sell signals while the daily trend is up, and block buy signals while the daily trend is down. This is the setting most responsible for avoiding "buying a dip that's actually the start of a crash."
Gray line = neutral. Red = in overbought zone. Blue = in oversold zone.
A triangle signal only appears after price has confirmed its way back out of the zone (controlled by "Bars to Confirm Exit From Zone") — this is what prevents you from selling into a strong momentum spike that keeps climbing.
The bands themselves move (adaptive mode) — during high volatility they widen, so you don't get an overbought signal every 20 minutes; during quiet chop they tighten, so you still catch real extremes.
The trend filter checks a daily EMA by default — it will block sell signals while the daily trend is up, and block buy signals while the daily trend is down. This is the setting most responsible for avoiding "buying a dip that's actually the start of a crash."
릴리즈 노트
How it works, and how to tune it:Gray line = neutral. Red = in overbought zone. Blue = in oversold zone.
A triangle signal only appears after price has confirmed its way back out of the zone (controlled by "Bars to Confirm Exit From Zone") — this is what prevents you from selling into a strong momentum spike that keeps climbing.
The bands themselves move (adaptive mode) — during high volatility they widen, so you don't get an overbought signal every 20 minutes; during quiet chop they tighten, so you still catch real extremes.
The trend filter checks a daily EMA by default — it will block sell signals while the daily trend is up, and block buy signals while the daily trend is down. This is the setting most responsible for avoiding "buying a dip that's actually the start of a crash."
오픈 소스 스크립트
트레이딩뷰의 진정한 정신에 따라, 이 스크립트의 작성자는 이를 오픈소스로 공개하여 트레이더들이 기능을 검토하고 검증할 수 있도록 했습니다. 작성자에게 찬사를 보냅니다! 이 코드는 무료로 사용할 수 있지만, 코드를 재게시하는 경우 하우스 룰이 적용된다는 점을 기억하세요.

면책사항
해당 정보와 게시물은 금융, 투자, 트레이딩 또는 기타 유형의 조언이나 권장 사항으로 간주되지 않으며, 트레이딩뷰에서 제공하거나 보증하는 것이 아닙니다. 자세한 내용은 이용 약관을 참조하세요.
오픈 소스 스크립트
트레이딩뷰의 진정한 정신에 따라, 이 스크립트의 작성자는 이를 오픈소스로 공개하여 트레이더들이 기능을 검토하고 검증할 수 있도록 했습니다. 작성자에게 찬사를 보냅니다! 이 코드는 무료로 사용할 수 있지만, 코드를 재게시하는 경우 하우스 룰이 적용된다는 점을 기억하세요.
면책사항
해당 정보와 게시물은 금융, 투자, 트레이딩 또는 기타 유형의 조언이나 권장 사항으로 간주되지 않으며, 트레이딩뷰에서 제공하거나 보증하는 것이 아닙니다. 자세한 내용은 이용 약관을 참조하세요.