OPEN-SOURCE SCRIPT
Volume Strength Shift [MMT]
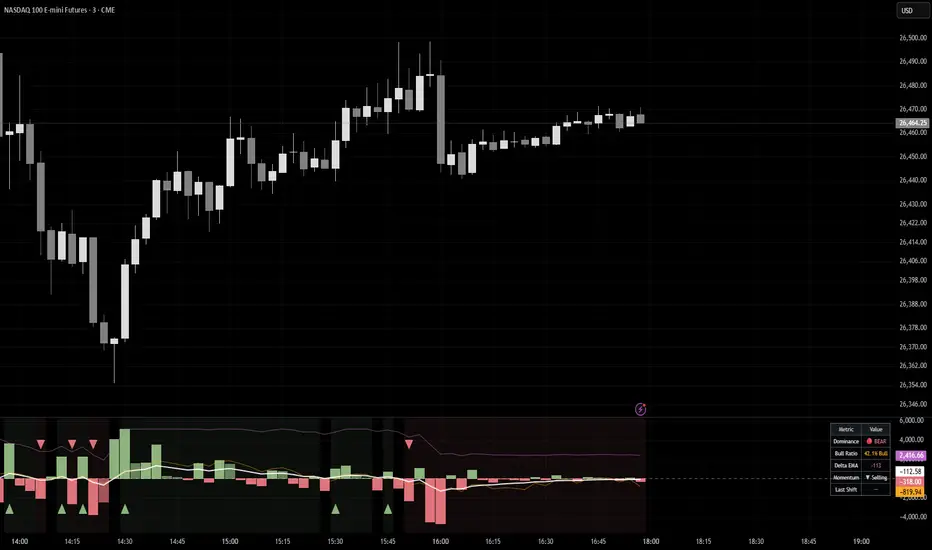
Volume Strength Shift [MMT] helps you see when buying or selling pressure is starting to take control. It breaks each candle’s volume into a bull side and a bear side, then highlights when one side begins to dominate.
This indicator is built to make volume easier to read at a glance. Green areas show bullish strength, red areas show bearish strength, and the shift arrows point out when momentum is changing. The smoothed delta line, bull ratio line, and scaled CVD line give you extra confirmation without making the chart too complicated. TradingView’s own volume delta tools also focus on comparing buying and selling pressure to help traders judge sentiment and momentum.
How to Use It
Best For
Spotting momentum shifts early.
What It Shows
Simple Idea
If price is moving up but the indicator is still red or neutral, the move may be weak. If price flips up and the indicator turns green at the same time, that gives you stronger confirmation that buyers are stepping in.
This indicator is built to make volume easier to read at a glance. Green areas show bullish strength, red areas show bearish strength, and the shift arrows point out when momentum is changing. The smoothed delta line, bull ratio line, and scaled CVD line give you extra confirmation without making the chart too complicated. TradingView’s own volume delta tools also focus on comparing buying and selling pressure to help traders judge sentiment and momentum.
How to Use It
- Look for a bull shift when the indicator turns green and the bullish arrow appears.
- Look for a bear shift when the indicator turns red and the bearish arrow appears.
- Use the background tint to quickly see which side is in control.
- Use the CVD and bull ratio lines to confirm whether strength is building or fading.
Best For
Spotting momentum shifts early.
- Confirming entries on CBC or other momentum-based strategies.
- Filtering out weak or low-conviction moves.
- Understanding whether volume is supporting the current trend.
What It Shows
- Histogram bars: volume strength by direction.
- Smoothed delta: the main trend of volume pressure.
- Bull ratio line: how much of volume is leaning bullish.
- Scaled CVD line: the running balance of buying vs. selling pressure.
- Shift arrows: when dominance changes from one side to the other.
Simple Idea
If price is moving up but the indicator is still red or neutral, the move may be weak. If price flips up and the indicator turns green at the same time, that gives you stronger confirmation that buyers are stepping in.
오픈 소스 스크립트
트레이딩뷰의 진정한 정신에 따라, 이 스크립트의 작성자는 이를 오픈소스로 공개하여 트레이더들이 기능을 검토하고 검증할 수 있도록 했습니다. 작성자에게 찬사를 보냅니다! 이 코드는 무료로 사용할 수 있지만, 코드를 재게시하는 경우 하우스 룰이 적용된다는 점을 기억하세요.

면책사항
해당 정보와 게시물은 금융, 투자, 트레이딩 또는 기타 유형의 조언이나 권장 사항으로 간주되지 않으며, 트레이딩뷰에서 제공하거나 보증하는 것이 아닙니다. 자세한 내용은 이용 약관을 참조하세요.
오픈 소스 스크립트
트레이딩뷰의 진정한 정신에 따라, 이 스크립트의 작성자는 이를 오픈소스로 공개하여 트레이더들이 기능을 검토하고 검증할 수 있도록 했습니다. 작성자에게 찬사를 보냅니다! 이 코드는 무료로 사용할 수 있지만, 코드를 재게시하는 경우 하우스 룰이 적용된다는 점을 기억하세요.
면책사항
해당 정보와 게시물은 금융, 투자, 트레이딩 또는 기타 유형의 조언이나 권장 사항으로 간주되지 않으며, 트레이딩뷰에서 제공하거나 보증하는 것이 아닙니다. 자세한 내용은 이용 약관을 참조하세요.