OPEN-SOURCE SCRIPT
업데이트됨 PCRXS Forecast Engine v1.0
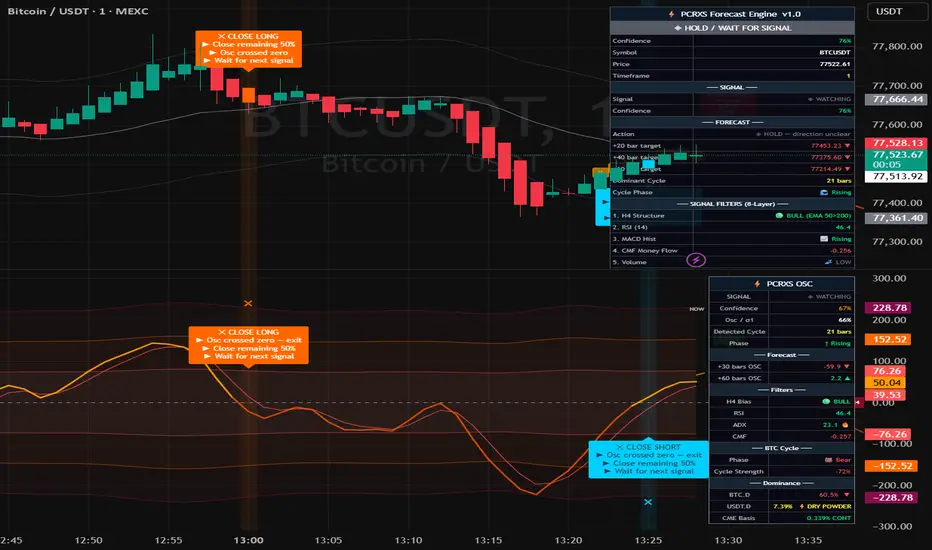
⚡ PCRXS Forecast Engine — Price Forecast
The dashed orange lines extending to the right of the current bar are a composite mathematical projection of where price is likely to go, built from 10 components that run simultaneously:
ComponentWhat it capturesLinear regression trendThe current slope and direction of the marketShort cycleDominant swing cycle auto-detected from your chart's pivot highsMedium cycle3× the short cycle — the bigger swing structureBTC halving cycle4-year model anchored to Apr 2024 halvingDXY inverseDollar strength drag/tailwind on cryptoS&P 500Risk-on/off correlation nudgeGoldSafe haven signal — rising gold dampens cryptoFear & GreedATR-based volatility proxyUSDT.D flowStablecoin capital entering or leaving cryptoCME futures basisInstitutional sentiment (contango vs backwardation)
What you see on the chart:
🟠 Dashed orange line — the composite forecast path
Dotted lines above/below — confidence bands that widen with distance (wider = less certain)
🟢 Green labels at troughs — predicted low points with date and price → where to Close Short / Buy Long
🔴 Red labels at peaks — predicted high points with date and price → where to Close Long / Buy Short
↑ ↓ labels on zero line — where the oscillator is forecast to cross zero → anticipated entry zones
The confidence % shown on each label reflects how many of the 19 market factors are pointing in the same direction. Above 70% is high conviction. Below 50% means mixed signals — treat the forecast as directional guidance only, not a guarantee.
The dashed orange lines extending to the right of the current bar are a composite mathematical projection of where price is likely to go, built from 10 components that run simultaneously:
ComponentWhat it capturesLinear regression trendThe current slope and direction of the marketShort cycleDominant swing cycle auto-detected from your chart's pivot highsMedium cycle3× the short cycle — the bigger swing structureBTC halving cycle4-year model anchored to Apr 2024 halvingDXY inverseDollar strength drag/tailwind on cryptoS&P 500Risk-on/off correlation nudgeGoldSafe haven signal — rising gold dampens cryptoFear & GreedATR-based volatility proxyUSDT.D flowStablecoin capital entering or leaving cryptoCME futures basisInstitutional sentiment (contango vs backwardation)
What you see on the chart:
🟠 Dashed orange line — the composite forecast path
Dotted lines above/below — confidence bands that widen with distance (wider = less certain)
🟢 Green labels at troughs — predicted low points with date and price → where to Close Short / Buy Long
🔴 Red labels at peaks — predicted high points with date and price → where to Close Long / Buy Short
↑ ↓ labels on zero line — where the oscillator is forecast to cross zero → anticipated entry zones
The confidence % shown on each label reflects how many of the 19 market factors are pointing in the same direction. Above 70% is high conviction. Below 50% means mixed signals — treat the forecast as directional guidance only, not a guarantee.
릴리즈 노트
Minor cosmetic fixes오픈 소스 스크립트
트레이딩뷰의 진정한 정신에 따라, 이 스크립트의 작성자는 이를 오픈소스로 공개하여 트레이더들이 기능을 검토하고 검증할 수 있도록 했습니다. 작성자에게 찬사를 보냅니다! 이 코드는 무료로 사용할 수 있지만, 코드를 재게시하는 경우 하우스 룰이 적용된다는 점을 기억하세요.

면책사항
해당 정보와 게시물은 금융, 투자, 트레이딩 또는 기타 유형의 조언이나 권장 사항으로 간주되지 않으며, 트레이딩뷰에서 제공하거나 보증하는 것이 아닙니다. 자세한 내용은 이용 약관을 참조하세요.
오픈 소스 스크립트
트레이딩뷰의 진정한 정신에 따라, 이 스크립트의 작성자는 이를 오픈소스로 공개하여 트레이더들이 기능을 검토하고 검증할 수 있도록 했습니다. 작성자에게 찬사를 보냅니다! 이 코드는 무료로 사용할 수 있지만, 코드를 재게시하는 경우 하우스 룰이 적용된다는 점을 기억하세요.
면책사항
해당 정보와 게시물은 금융, 투자, 트레이딩 또는 기타 유형의 조언이나 권장 사항으로 간주되지 않으며, 트레이딩뷰에서 제공하거나 보증하는 것이 아닙니다. 자세한 내용은 이용 약관을 참조하세요.