업데이트됨
MTF EMA Directional Bias -1hr and 4hr
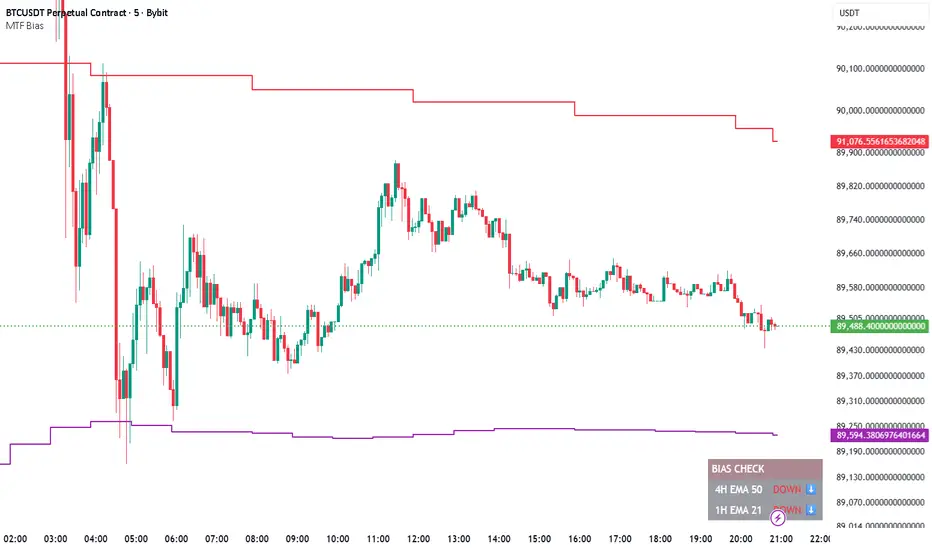
A compact, fixed-position table (bottom-right corner) that shows the current slope direction of two higher-timeframe EMAs:
4H EMA 50 → direction over the last 2 bars (UP ↑, DOWN ↓, or FLAT ⏸)
1H EMA 21 → direction over the last 2 bars (UP ↑, DOWN ↓, or FLAT ⏸)
Background color logic:
Green → both 4H and 1H EMAs are sloping upward
Red → both 4H and 1H EMAs are sloping downward
Gray → mixed or flat directions (no confluence)
Additionally draws the actual 1H EMA-21 (purple) and 4H EMA-50 (red) as step-lines on the chart.
4H EMA 50 → direction over the last 2 bars (UP ↑, DOWN ↓, or FLAT ⏸)
1H EMA 21 → direction over the last 2 bars (UP ↑, DOWN ↓, or FLAT ⏸)
Background color logic:
Green → both 4H and 1H EMAs are sloping upward
Red → both 4H and 1H EMAs are sloping downward
Gray → mixed or flat directions (no confluence)
Additionally draws the actual 1H EMA-21 (purple) and 4H EMA-50 (red) as step-lines on the chart.
릴리즈 노트
What this update doesThis indicator shows the market’s trend direction using two higher-timeframe EMAs:
4-Hour EMA 50 → big picture trend
1-Hour EMA 21 → short-term trend
It compares each EMA to where it was a few candles ago to see if it is:
Going up
Going down
Or flat
Those directions are shown in the table on your chart.
How to read it
If both 4H and 1H are UP → the market is bullish
If both 4H and 1H are DOWN → the market is bearish
If they disagree → the market is mixed or choppy
The background color changes to show this:
Green = bullish
Red = bearish
Grey = no clear trend
The EMA lines on the chart are the same values used in the table.
What it’s for
This is not an entry signal.
It’s a direction filter — it tells you which side of the market you should be trading with.
Trade with the bias.
Avoid trades against it.
Simple, mechanical, no guessing.

면책사항
해당 정보와 게시물은 금융, 투자, 트레이딩 또는 기타 유형의 조언이나 권장 사항으로 간주되지 않으며, 트레이딩뷰에서 제공하거나 보증하는 것이 아닙니다. 자세한 내용은 이용 약관을 참조하세요.
면책사항
해당 정보와 게시물은 금융, 투자, 트레이딩 또는 기타 유형의 조언이나 권장 사항으로 간주되지 않으며, 트레이딩뷰에서 제공하거나 보증하는 것이 아닙니다. 자세한 내용은 이용 약관을 참조하세요.