Trend Matrix V12
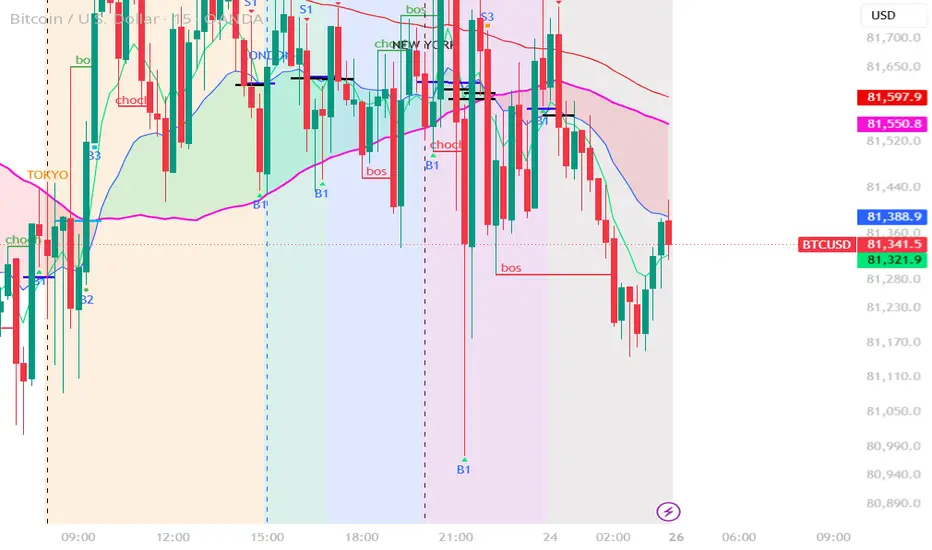
📊 **Introducing Trend Matrix V12**
*A Multi-Layer Trend Structure Framework*
Trend Matrix V12 is a comprehensive TradingView indicator designed to help traders analyze market trends, moving average crossovers, market structure, and major trading sessions — all in one chart.
🔹 **1. Six Customizable Moving Averages**
Supports six moving average lines using SMA, EMA, and SMMA. Traders can customize each period, select the MA type, and toggle individual lines on or off according to their trading preferences.
🔹 **2. Trend Ribbon**
Displays a colored ribbon between MA2 (EMA 20) and MA3 (SMA 60) to make trend relationships easier to visualize.
🟢 Green: EMA 20 is above SMA 60
🔴 Red: EMA 20 is below SMA 60
🔹 **3. Multi-Level Crossover Signals**
Identifies three levels of moving average crossovers:
- **B1 / S1:** EMA 7 crosses EMA 20
- **B2 / S2:** EMA 7 crosses SMA 60
- **B3 / S3:** EMA 20 crosses SMA 60
These signals help traders monitor changes in moving average relationships and identify potential trading opportunities.
🔹 **4. Market Structure — BOS / CHOCH**
Detects potential market structure breaks using Swing High and Swing Low levels.
- **BOS (Break of Structure):** Identifies a break that may indicate trend continuation.
- **CHOCH (Change of Character):** Highlights a potential change in market direction.
Structure lines and labels help traders visualize important price levels.
🔹 **5. Crossover Levels**
Draws horizontal reference lines around selected moving average levels associated with crossover signals, making it easier to review signal locations on the chart.
🔹 **6. Trading Session Visualization**
Highlights three major trading sessions using Thailand time (GMT+7):
- Tokyo Session
- London Session
- New York Session
Session markers, vertical lines, and background colors help traders identify the relevant trading periods.
🔹 **7. Customization & Chart Management**
Includes configurable Swing Length, feature visibility controls, and line management settings to help traders tailor the chart to their preferred analysis style.
🎯 **The Trend Matrix V12 Concept**
Rather than relying on a single indicator, Trend Matrix V12 brings together four key analytical components:
**Trend Analysis + Moving Average Crossovers + Market Structure + Trading Sessions**
The goal is to provide a more organized view of market conditions and support a structured trading decision-making process.
⚠️ **Risk Disclaimer**
Trend Matrix V12 is an analytical tool, not a guarantee of profitable trades. Crossover signals and market structure patterns may produce false signals. Always test the indicator, apply appropriate risk management, and evaluate your strategy before trading with real money.
#TrendMatrixV12 #TradingView #TechnicalAnalysis #MovingAverages #BOS #CHOCH #TradingSystem
*A Multi-Layer Trend Structure Framework*
Trend Matrix V12 is a comprehensive TradingView indicator designed to help traders analyze market trends, moving average crossovers, market structure, and major trading sessions — all in one chart.
🔹 **1. Six Customizable Moving Averages**
Supports six moving average lines using SMA, EMA, and SMMA. Traders can customize each period, select the MA type, and toggle individual lines on or off according to their trading preferences.
🔹 **2. Trend Ribbon**
Displays a colored ribbon between MA2 (EMA 20) and MA3 (SMA 60) to make trend relationships easier to visualize.
🟢 Green: EMA 20 is above SMA 60
🔴 Red: EMA 20 is below SMA 60
🔹 **3. Multi-Level Crossover Signals**
Identifies three levels of moving average crossovers:
- **B1 / S1:** EMA 7 crosses EMA 20
- **B2 / S2:** EMA 7 crosses SMA 60
- **B3 / S3:** EMA 20 crosses SMA 60
These signals help traders monitor changes in moving average relationships and identify potential trading opportunities.
🔹 **4. Market Structure — BOS / CHOCH**
Detects potential market structure breaks using Swing High and Swing Low levels.
- **BOS (Break of Structure):** Identifies a break that may indicate trend continuation.
- **CHOCH (Change of Character):** Highlights a potential change in market direction.
Structure lines and labels help traders visualize important price levels.
🔹 **5. Crossover Levels**
Draws horizontal reference lines around selected moving average levels associated with crossover signals, making it easier to review signal locations on the chart.
🔹 **6. Trading Session Visualization**
Highlights three major trading sessions using Thailand time (GMT+7):
- Tokyo Session
- London Session
- New York Session
Session markers, vertical lines, and background colors help traders identify the relevant trading periods.
🔹 **7. Customization & Chart Management**
Includes configurable Swing Length, feature visibility controls, and line management settings to help traders tailor the chart to their preferred analysis style.
🎯 **The Trend Matrix V12 Concept**
Rather than relying on a single indicator, Trend Matrix V12 brings together four key analytical components:
**Trend Analysis + Moving Average Crossovers + Market Structure + Trading Sessions**
The goal is to provide a more organized view of market conditions and support a structured trading decision-making process.
⚠️ **Risk Disclaimer**
Trend Matrix V12 is an analytical tool, not a guarantee of profitable trades. Crossover signals and market structure patterns may produce false signals. Always test the indicator, apply appropriate risk management, and evaluate your strategy before trading with real money.
#TrendMatrixV12 #TradingView #TechnicalAnalysis #MovingAverages #BOS #CHOCH #TradingSystem

면책사항
해당 정보와 게시물은 금융, 투자, 트레이딩 또는 기타 유형의 조언이나 권장 사항으로 간주되지 않으며, 트레이딩뷰에서 제공하거나 보증하는 것이 아닙니다. 자세한 내용은 이용 약관을 참조하세요.
면책사항
해당 정보와 게시물은 금융, 투자, 트레이딩 또는 기타 유형의 조언이나 권장 사항으로 간주되지 않으며, 트레이딩뷰에서 제공하거나 보증하는 것이 아닙니다. 자세한 내용은 이용 약관을 참조하세요.