OPEN-SOURCE SCRIPT
업데이트됨 MTF ATR(1H,4H,1D,1W,1M) with ATH and Heat line
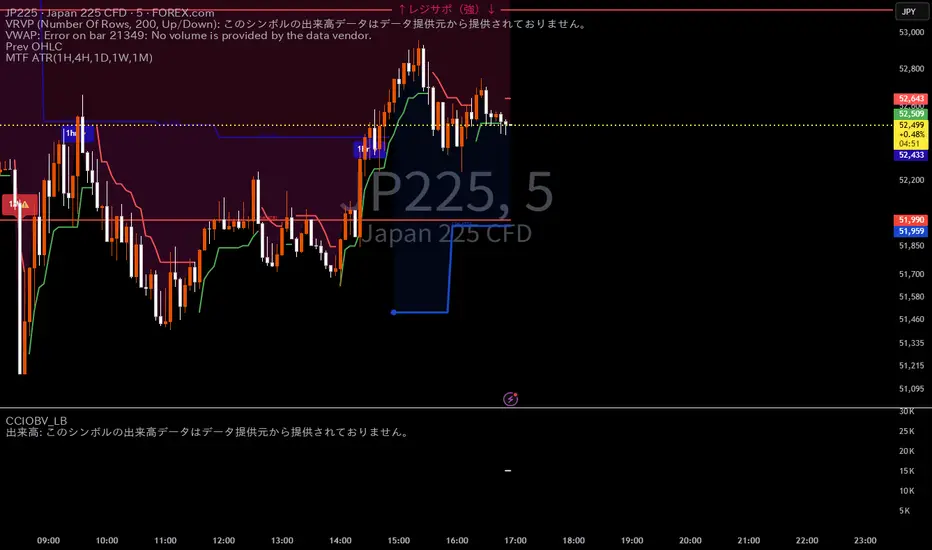
# MTF ATR (1H, 4H, 1D, 1W, 1M) with ATH and Overheating Line
## Overview
A multi-timeframe ATR-based Supertrend indicator that displays trend lines across five timeframes — 1 Hour, 4 Hour, 1 Day, 1 Week, and 1 Month — on a single chart. Designed for swing traders who use ATR (Average True Range) as the core framework for trend-following and risk management.
This indicator lets you see the key support/resistance levels across multiple timeframes at a glance, helping you make better decisions about entries, exits, and position sizing without switching between charts.
---
## Key Features
### Multi-Timeframe Supertrend (1H / 4H / 1D / 1W / 1M)
Each timeframe calculates its own Supertrend line based on ATR, providing a layered view of trend structure from intraday to macro:
- **1H Supertrend** — Short-term trend for timing entries and exits. Color: Blue.
- **4H Supertrend** — Medium-term trend bridging intraday and swing timeframes. Color: Purple.
- **1D Supertrend** — Primary swing trading trend. Color: Green (up) / Dark Red (down).
- **1W Supertrend** — Macro trend filter. Color: Pink.
- **1M Supertrend** — The longest-term trend context, useful for identifying secular trend direction and major structural support/resistance. Color: Red.
The 1D, 1W, and 1M Supertrend lines are all calculated using confirmed (closed) data from the prior period. This means the line does not move during the current day/week/month — the goalpost stays fixed, giving you a stable reference point for decision-making.
### Overheating Line (v2)
A unique profit-taking guide built on top of the daily Supertrend. The Overheating Line marks the level where price has extended significantly beyond the Supertrend — a zone where mean reversion risk increases.
**Formula:** `Current Day Realtime Supertrend + (Previous Day Confirmed ATR × Multiplier)`
This hybrid design gives you the best of both worlds:
- The **starting point** (realtime ST) adapts to gap-ups and intraday price action.
- The **threshold** (previous day's ATR × multiplier) is fixed, so the target does not shift as the day progresses.
The default multiplier is 1.3× ATR, adjustable in settings. The Overheating Line is hidden on daily and higher timeframes by default (designed for intraday use), but this can be toggled.
### Overheating Touch Signals (Optional, Default: OFF)
When enabled, the indicator tracks intraday interaction with the Overheating Line:
- 🔥 **Touch Signal** — Price (high) reaches the Overheating Line for the first time that day.
- ❄️ **Break Signal** — After touching, price closes back below the Overheating Line (potential reversal confirmation).
### Overheating Status Table
A real-time dashboard (top-right corner) displaying:
- **ST Deviation Ratio** — Distance from Supertrend measured in ATR multiples. Color-coded: green (safe), orange (approaching), red (overheated).
- **Distance to Overheating Line** — Absolute and percentage.
- **Overheating Line Value** — Exact price level.
- **Base ATR (Previous Day)** — The fixed ATR used for calculation.
- **Current Day ST** — Realtime Supertrend value.
- **Today's Touch Status** — Whether the line has been touched.
- **Post-Touch Tracking** (when touched) — Elapsed time, max drawdown from touch, and whether price has broken back below the line.
Hidden on daily+ timeframes by default.
### Warning & Break Signals
Available for 1H, 4H, 1D, and 1W timeframes:
- **⚠️ Warning** — Price closes below the uptrend Supertrend line (potential trend weakening).
- **⚡ Break** — Price closes above the downtrend Supertrend line (potential trend reversal to upside).
Signal cooldowns vary by timeframe to avoid noise:
| Timeframe | Warning Cooldown | Break Cooldown | Max per Period | Reset |
|-----------|-----------------|----------------|----------------|-------|
| 1H | 4 hours | 1 hour | Unlimited | — |
| 4H | 4 hours | 1 hour | 2 per day | Daily |
| 1D | 4 hours | 1 hour | 2 per day | Daily |
| 1W | 4 days | 4 days | 2 per week | Weekly |
The 1M Supertrend does not generate warning/break signals — it serves purely as a structural trend reference.
### All-Time High (ATH) Finder
Automatically detects and draws a horizontal line at the all-time high, extending to the right edge of the chart. Includes a label with the exact ATH value. Useful for breakout targets and overhead resistance identification.
---
## Color Scheme
| Timeframe | Up Trend | Down Trend |
|-----------|----------|------------|
| Current TF | Green | Red |
| 1H | Blue (#1848cc) | Dark Blue (#210ba2) |
| 4H | Purple (#7b1fa2) | Dark Purple (#4e0f60) |
| 1D | Green (#4caf50) | Dark Red (#8c101a) |
| 1W | Pink (#f06292) | Dark Pink (#c2185b) |
| 1M | Red (#f44336) | Dark Red (#b71c1c) |
| Overheating | Orange (#ff9800) | — |
| ATH | Lime | — |
---
## Timeframe Visibility
By default, 1H and 4H Supertrends (along with their signals and labels) are hidden when viewing daily or higher timeframes to reduce clutter. The 1D, 1W, and 1M Supertrends are always visible regardless of chart timeframe. This behavior can be changed in settings.
---
## Master Controls
Four master toggles to quickly show/hide elements across all timeframes:
- **Master Highlighter** — Background shading between price and Supertrend.
- **Master Signals** — All warning/break signal labels.
- **Master Up Trend** — All uptrend lines and trend-change circles.
- **Master Down Trend** — All downtrend lines and trend-change circles.
---
## Settings Per Timeframe
Each timeframe has independent settings:
| Setting | Current TF | 1H | 4H | 1D | 1W | 1M |
|---------|:---:|:---:|:---:|:---:|:---:|:---:|
| ATR Period | ✓ | ✓ | ✓ | ✓ | ✓ | ✓ |
| ATR Multiplier | ✓ | ✓ | ✓ | ✓ | ✓ | ✓ |
| ATR Method | ✓ | ✓ | ✓ | ✓ | ✓ | ✓ |
| Show/Hide | — | ✓ | ✓ | ✓ | ✓ | ✓ |
| Labels | — | ✓ | ✓ | ✓ | ✓ | ✓ |
| Warning/Break | — | ✓ | ✓ | ✓ | ✓ | — |
| Highlighter | — | ✓ | ✓ | ✓ | ✓ | — |
Default ATR Period is 10 and Multiplier is 1.0 for all timeframes.
---
## Alerts
| Alert | Description |
|-------|-------------|
| Buy / Sell | Current timeframe trend change |
| 1H / 4H / 1D / 1W Warning | Price breaks below uptrend Supertrend |
| 1H / 4H / 1D / 1W Break | Price breaks above downtrend Supertrend |
| 1W / 1M Trend Change | Weekly or monthly trend direction change (up/down) |
| Overheating Touch | Price reaches the Overheating Line |
| Overheating Break | Price falls back below the Overheating Line after touch |
---
## Recommended Usage
1. **Trend Alignment** — Look for trades where 1D, 1W, and 1M trends are all aligned (all in uptrend). The more timeframes aligned, the higher the conviction.
2. **Structural Context with 1M** — The monthly Supertrend acts as the "line in the sand" for secular trend direction. When price is above the 1M line and the 1M trend is up, the broader environment favors long positions.
3. **Profit Taking** — Monitor the Overheating Line and ST Deviation Ratio. When the ratio approaches or exceeds the multiplier (default 1.3×), consider scaling out or tightening stops.
4. **Stop Loss Reference** — The 1D Supertrend provides a natural swing stop level. The 4H or 1H lines can serve as trailing stops for more aggressive management. The 1W and 1M lines serve as wider structural stops for position trades.
5. **Warning as Early Alert** — A ⚠️ warning does not mean the trend is over, but it flags that price has temporarily dipped below the Supertrend — a signal to watch closely rather than panic.
---
## Technical Notes
- The 1D, 1W, and 1M Supertrends use previous-period confirmed data (`lookahead_off`), ensuring lines do not repaint or shift during the current period.
- The Overheating Line's realtime component uses `lookahead_on` intentionally to reflect intraday price action for the starting point, while keeping the ATR threshold fixed from the prior day.
- This indicator is an overlay and works on any instrument and timeframe. It is primarily designed for use on 5-minute to 1-hour charts for Japanese and US equities.
- Due to TradingView's 64-plot limit, EMA overlays and background highlighters for the current timeframe and monthly timeframe are not included. The 1M Supertrend displays trend lines and labels only (no highlighter or warning/break signals).
## Overview
A multi-timeframe ATR-based Supertrend indicator that displays trend lines across five timeframes — 1 Hour, 4 Hour, 1 Day, 1 Week, and 1 Month — on a single chart. Designed for swing traders who use ATR (Average True Range) as the core framework for trend-following and risk management.
This indicator lets you see the key support/resistance levels across multiple timeframes at a glance, helping you make better decisions about entries, exits, and position sizing without switching between charts.
---
## Key Features
### Multi-Timeframe Supertrend (1H / 4H / 1D / 1W / 1M)
Each timeframe calculates its own Supertrend line based on ATR, providing a layered view of trend structure from intraday to macro:
- **1H Supertrend** — Short-term trend for timing entries and exits. Color: Blue.
- **4H Supertrend** — Medium-term trend bridging intraday and swing timeframes. Color: Purple.
- **1D Supertrend** — Primary swing trading trend. Color: Green (up) / Dark Red (down).
- **1W Supertrend** — Macro trend filter. Color: Pink.
- **1M Supertrend** — The longest-term trend context, useful for identifying secular trend direction and major structural support/resistance. Color: Red.
The 1D, 1W, and 1M Supertrend lines are all calculated using confirmed (closed) data from the prior period. This means the line does not move during the current day/week/month — the goalpost stays fixed, giving you a stable reference point for decision-making.
### Overheating Line (v2)
A unique profit-taking guide built on top of the daily Supertrend. The Overheating Line marks the level where price has extended significantly beyond the Supertrend — a zone where mean reversion risk increases.
**Formula:** `Current Day Realtime Supertrend + (Previous Day Confirmed ATR × Multiplier)`
This hybrid design gives you the best of both worlds:
- The **starting point** (realtime ST) adapts to gap-ups and intraday price action.
- The **threshold** (previous day's ATR × multiplier) is fixed, so the target does not shift as the day progresses.
The default multiplier is 1.3× ATR, adjustable in settings. The Overheating Line is hidden on daily and higher timeframes by default (designed for intraday use), but this can be toggled.
### Overheating Touch Signals (Optional, Default: OFF)
When enabled, the indicator tracks intraday interaction with the Overheating Line:
- 🔥 **Touch Signal** — Price (high) reaches the Overheating Line for the first time that day.
- ❄️ **Break Signal** — After touching, price closes back below the Overheating Line (potential reversal confirmation).
### Overheating Status Table
A real-time dashboard (top-right corner) displaying:
- **ST Deviation Ratio** — Distance from Supertrend measured in ATR multiples. Color-coded: green (safe), orange (approaching), red (overheated).
- **Distance to Overheating Line** — Absolute and percentage.
- **Overheating Line Value** — Exact price level.
- **Base ATR (Previous Day)** — The fixed ATR used for calculation.
- **Current Day ST** — Realtime Supertrend value.
- **Today's Touch Status** — Whether the line has been touched.
- **Post-Touch Tracking** (when touched) — Elapsed time, max drawdown from touch, and whether price has broken back below the line.
Hidden on daily+ timeframes by default.
### Warning & Break Signals
Available for 1H, 4H, 1D, and 1W timeframes:
- **⚠️ Warning** — Price closes below the uptrend Supertrend line (potential trend weakening).
- **⚡ Break** — Price closes above the downtrend Supertrend line (potential trend reversal to upside).
Signal cooldowns vary by timeframe to avoid noise:
| Timeframe | Warning Cooldown | Break Cooldown | Max per Period | Reset |
|-----------|-----------------|----------------|----------------|-------|
| 1H | 4 hours | 1 hour | Unlimited | — |
| 4H | 4 hours | 1 hour | 2 per day | Daily |
| 1D | 4 hours | 1 hour | 2 per day | Daily |
| 1W | 4 days | 4 days | 2 per week | Weekly |
The 1M Supertrend does not generate warning/break signals — it serves purely as a structural trend reference.
### All-Time High (ATH) Finder
Automatically detects and draws a horizontal line at the all-time high, extending to the right edge of the chart. Includes a label with the exact ATH value. Useful for breakout targets and overhead resistance identification.
---
## Color Scheme
| Timeframe | Up Trend | Down Trend |
|-----------|----------|------------|
| Current TF | Green | Red |
| 1H | Blue (#1848cc) | Dark Blue (#210ba2) |
| 4H | Purple (#7b1fa2) | Dark Purple (#4e0f60) |
| 1D | Green (#4caf50) | Dark Red (#8c101a) |
| 1W | Pink (#f06292) | Dark Pink (#c2185b) |
| 1M | Red (#f44336) | Dark Red (#b71c1c) |
| Overheating | Orange (#ff9800) | — |
| ATH | Lime | — |
---
## Timeframe Visibility
By default, 1H and 4H Supertrends (along with their signals and labels) are hidden when viewing daily or higher timeframes to reduce clutter. The 1D, 1W, and 1M Supertrends are always visible regardless of chart timeframe. This behavior can be changed in settings.
---
## Master Controls
Four master toggles to quickly show/hide elements across all timeframes:
- **Master Highlighter** — Background shading between price and Supertrend.
- **Master Signals** — All warning/break signal labels.
- **Master Up Trend** — All uptrend lines and trend-change circles.
- **Master Down Trend** — All downtrend lines and trend-change circles.
---
## Settings Per Timeframe
Each timeframe has independent settings:
| Setting | Current TF | 1H | 4H | 1D | 1W | 1M |
|---------|:---:|:---:|:---:|:---:|:---:|:---:|
| ATR Period | ✓ | ✓ | ✓ | ✓ | ✓ | ✓ |
| ATR Multiplier | ✓ | ✓ | ✓ | ✓ | ✓ | ✓ |
| ATR Method | ✓ | ✓ | ✓ | ✓ | ✓ | ✓ |
| Show/Hide | — | ✓ | ✓ | ✓ | ✓ | ✓ |
| Labels | — | ✓ | ✓ | ✓ | ✓ | ✓ |
| Warning/Break | — | ✓ | ✓ | ✓ | ✓ | — |
| Highlighter | — | ✓ | ✓ | ✓ | ✓ | — |
Default ATR Period is 10 and Multiplier is 1.0 for all timeframes.
---
## Alerts
| Alert | Description |
|-------|-------------|
| Buy / Sell | Current timeframe trend change |
| 1H / 4H / 1D / 1W Warning | Price breaks below uptrend Supertrend |
| 1H / 4H / 1D / 1W Break | Price breaks above downtrend Supertrend |
| 1W / 1M Trend Change | Weekly or monthly trend direction change (up/down) |
| Overheating Touch | Price reaches the Overheating Line |
| Overheating Break | Price falls back below the Overheating Line after touch |
---
## Recommended Usage
1. **Trend Alignment** — Look for trades where 1D, 1W, and 1M trends are all aligned (all in uptrend). The more timeframes aligned, the higher the conviction.
2. **Structural Context with 1M** — The monthly Supertrend acts as the "line in the sand" for secular trend direction. When price is above the 1M line and the 1M trend is up, the broader environment favors long positions.
3. **Profit Taking** — Monitor the Overheating Line and ST Deviation Ratio. When the ratio approaches or exceeds the multiplier (default 1.3×), consider scaling out or tightening stops.
4. **Stop Loss Reference** — The 1D Supertrend provides a natural swing stop level. The 4H or 1H lines can serve as trailing stops for more aggressive management. The 1W and 1M lines serve as wider structural stops for position trades.
5. **Warning as Early Alert** — A ⚠️ warning does not mean the trend is over, but it flags that price has temporarily dipped below the Supertrend — a signal to watch closely rather than panic.
---
## Technical Notes
- The 1D, 1W, and 1M Supertrends use previous-period confirmed data (`lookahead_off`), ensuring lines do not repaint or shift during the current period.
- The Overheating Line's realtime component uses `lookahead_on` intentionally to reflect intraday price action for the starting point, while keeping the ATR threshold fixed from the prior day.
- This indicator is an overlay and works on any instrument and timeframe. It is primarily designed for use on 5-minute to 1-hour charts for Japanese and US equities.
- Due to TradingView's 64-plot limit, EMA overlays and background highlighters for the current timeframe and monthly timeframe are not included. The 1M Supertrend displays trend lines and labels only (no highlighter or warning/break signals).
릴리즈 노트
# MTF ATR (1H, 4H, 1D, 1W, 1M) with ATH and Overheating LineMulti-timeframe ATR Supertrend across 5 timeframes (1H/4H/1D/1W/1M) on a single chart. Built for swing traders using ATR-based trend-following.
---
## Supertrend Lines
Each timeframe draws its own Supertrend. Higher timeframes (1D/1W/1M) use **previous-period confirmed data** so lines stay fixed during the current period — no repainting.
| TF | Color (Up / Down) | Highlighter |
|----|-------------------|:-----------:|
| Current | Green / Red | — |
| 1H | Blue / Dark Blue | ✓ |
| 4H | Purple / Dark Purple | ✓ |
| 1D | Green / Dark Red | ✓ |
| 1W | Pink / Dark Pink | ✓ |
| 1M | Red / Dark Red | — |
## Warning & Break Signals
- **⚠️ Warning** — Price closes below uptrend ST (trend weakening)
- **⚡ Break** — Price closes above downtrend ST (potential reversal)
| TF | Cooldown | Reset |
|----|----------|-------|
| 1H | 4hr / 1hr | — |
| 4H | 4hr / 1hr | Daily |
| 1D | 4hr / 1hr | Daily |
| 1W | 2 weeks | Monthly |
| 1M | 1 month | Monthly |
## Overheating Line
Profit-taking guide on intraday charts. Marks where price has extended too far above the daily ST.
**Formula:** Realtime ST + (Previous Day ATR × Multiplier)
- Realtime ST adapts to gap-ups; ATR threshold stays fixed all day
- Default multiplier: 1.3×
- Optional touch (🔥) and break (❄️) signals (default OFF)
- Status table shows deviation ratio, distance, and post-touch tracking
- Hidden on daily+ timeframes by default
## Other Features
- **ATH Finder** — Horizontal line at all-time high with label
- **Master Controls** — 4 toggles to show/hide highlighters, signals, up/down trends globally
- **Per-TF Settings** — ATR period, multiplier, method, labels, signals all independently configurable
- **Alerts** — Warning/Break for all 5 timeframes
## Usage Tips
1. Trade when 1D + 1W + 1M trends align
2. Use Overheating Line / deviation ratio for profit-taking
3. 1D ST = swing stop; 1H/4H = trailing stop; 1W/1M = structural stop
4. ⚠️ = watch closely, not panic
릴리즈 노트
# MTF ATR (1H, 4H, 1D, 1W, 1M) with ATH and Overheating LineMulti-timeframe ATR Supertrend across 5 timeframes (1H/4H/1D/1W/1M) on a single chart. Built for swing traders using ATR-based trend-following.
---
## Supertrend Lines
Each timeframe draws its own Supertrend. Higher timeframes (1D/1W/1M) use **previous-period confirmed data** so lines stay fixed during the current period — no repainting.
| TF | Color (Up / Down) | Highlighter |
|----|-------------------|:-----------:|
| Current | Green / Red | — |
| 1H | Blue / Dark Blue | ✓ |
| 4H | Purple / Dark Purple | ✓ |
| 1D | Green / Dark Red | ✓ |
| 1W | Pink / Dark Pink | ✓ |
| 1M | Red / Dark Red | — |
## Warning & Break Signals
- **⚠️ Warning** — Price closes below uptrend ST (trend weakening)
- **⚡ Break** — Price closes above downtrend ST (potential reversal)
| TF | Cooldown | Reset |
|----|----------|-------|
| 1H | 4hr / 1hr | — |
| 4H | 4hr / 1hr | Daily |
| 1D | 4hr / 1hr | Daily |
| 1W | 2 weeks | Monthly |
| 1M | 1 month | Monthly |
## Overheating Line
Profit-taking guide on intraday charts. Marks where price has extended too far above the daily ST.
**Formula:** Realtime ST + (Previous Day ATR × Multiplier)
- Realtime ST adapts to gap-ups; ATR threshold stays fixed all day
- Default multiplier: 1.3×
- Optional touch (🔥) and break (❄️) signals (default OFF)
- Status table shows deviation ratio, distance, and post-touch tracking
- Hidden on daily+ timeframes by default
## Other Features
- **ATH Finder** — Horizontal line at all-time high with label
- **Master Controls** — 4 toggles to show/hide highlighters, signals, up/down trends globally
- **Per-TF Settings** — ATR period, multiplier, method, labels, signals all independently configurable
- **Alerts** — Warning/Break for all 5 timeframes
## Usage Tips
1. Trade when 1D + 1W + 1M trends align
2. Use Overheating Line / deviation ratio for profit-taking
3. 1D ST = swing stop; 1H/4H = trailing stop; 1W/1M = structural stop
4. ⚠️ = watch closely, not panic
오픈 소스 스크립트
트레이딩뷰의 진정한 정신에 따라, 이 스크립트의 작성자는 이를 오픈소스로 공개하여 트레이더들이 기능을 검토하고 검증할 수 있도록 했습니다. 작성자에게 찬사를 보냅니다! 이 코드는 무료로 사용할 수 있지만, 코드를 재게시하는 경우 하우스 룰이 적용된다는 점을 기억하세요.

면책사항
해당 정보와 게시물은 금융, 투자, 트레이딩 또는 기타 유형의 조언이나 권장 사항으로 간주되지 않으며, 트레이딩뷰에서 제공하거나 보증하는 것이 아닙니다. 자세한 내용은 이용 약관을 참조하세요.
오픈 소스 스크립트
트레이딩뷰의 진정한 정신에 따라, 이 스크립트의 작성자는 이를 오픈소스로 공개하여 트레이더들이 기능을 검토하고 검증할 수 있도록 했습니다. 작성자에게 찬사를 보냅니다! 이 코드는 무료로 사용할 수 있지만, 코드를 재게시하는 경우 하우스 룰이 적용된다는 점을 기억하세요.
면책사항
해당 정보와 게시물은 금융, 투자, 트레이딩 또는 기타 유형의 조언이나 권장 사항으로 간주되지 않으며, 트레이딩뷰에서 제공하거나 보증하는 것이 아닙니다. 자세한 내용은 이용 약관을 참조하세요.