OPEN-SOURCE SCRIPT
Heatmap VWAP Profile [ChartPrime]
🔶 OVERVIEW
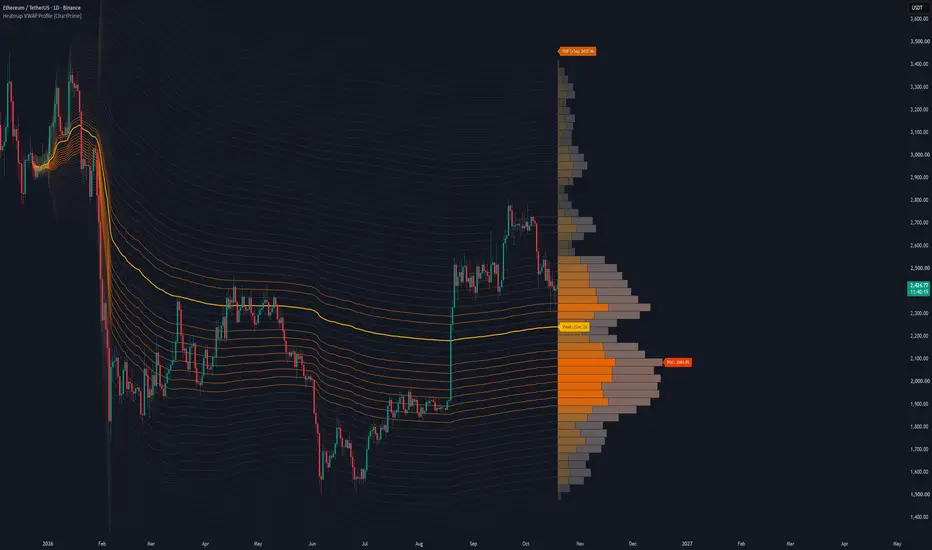
The Heatmap VWAP Profile [ChartPrime] indicator merges anchored Volume Weighted Average Price (VWAP) bands with an advanced heatmap volume profile. By projecting standard deviation channels forward from a user-defined anchor point and filling them with volume-weighted color gradients, it helps you visualize high-volume nodes (HVNs), low-volume nodes (LVNs), and the Point of Control (POC) directly on your chart.
🔶 HOW IT WORKS
The indicator operates through a multi-step analytical engine:
🔶 KEY FEATURES
🔶 TRADING APPLICATIONS
🔶 SETTINGS
🔶 CONCLUSION
The Heatmap VWAP Profile [ChartPrime] brings institutional order-flow visualization to your workspace. By combining anchored VWAP geometry with dynamic volume heatmaps, it gives you a clear visual edge in locating structural liquidity.
The Heatmap VWAP Profile [ChartPrime] indicator merges anchored Volume Weighted Average Price (VWAP) bands with an advanced heatmap volume profile. By projecting standard deviation channels forward from a user-defined anchor point and filling them with volume-weighted color gradients, it helps you visualize high-volume nodes (HVNs), low-volume nodes (LVNs), and the Point of Control (POC) directly on your chart.
🔶 HOW IT WORKS
The indicator operates through a multi-step analytical engine:
- Anchored VWAP Engine: Calculates cumulative price-volume action and standard deviation spread starting from a configurable lookback anchor bar.
- Dynamic Polyline Bands: Projects upper and lower standard deviation channels forward across the historical chart range.
- Volume Profile Binning: Maps up-volume and down-volume distribution across custom price rows between the outer deviation boundaries.
- Heatmap Gradient Transparency: Applies dynamic opacity and color palettes based on volume density to highlight key institutional trading zones.
🔶 KEY FEATURES
- Interactive Volume Profile Boxes: Renders side-by-side up and down volume nodes scaled to match active liquidity distribution.
- Heatmap Polylines: Connects standard deviation bands with gradient coloring and varying styles depending on volume magnitude.
- Point of Control (POC) Tracking: Automatically identifies and labels the exact price row holding the highest volume concentration.
- Custom Label Styling: Displays dedicated price tags for VWAP, the POC, and the upper/lower deviation boundaries.
🔶 TRADING APPLICATIONS
- Support & Resistance Mapping: Use high-volume nodes and the POC as natural magnet levels for price reversals or range boundaries.
- Volume Imbalance Detection: Look for low-volume nodes (LVNs) to identify areas where price may move rapidly due to a lack of resting liquidity.
- VWAP Trend Confluence: Gauge overall market bias and volatility expansion using the anchored VWAP baseline and its outer standard deviation bands.
🔶 SETTINGS
- Anchor & Band Settings: Controls lookback bar depth, polyline visibility, and the maximum standard deviation multiplier.
- Volume Profile Settings: Adjusts row counts and maximum profile width dimensions on the chart.
- Label Settings: Toggles price tag visibility and customizes label background and text colors.
- Color & Opacity Controls: Customizes the gold-and-bronze color palettes alongside transparency thresholds for high and low volume nodes.
🔶 CONCLUSION
The Heatmap VWAP Profile [ChartPrime] brings institutional order-flow visualization to your workspace. By combining anchored VWAP geometry with dynamic volume heatmaps, it gives you a clear visual edge in locating structural liquidity.
오픈 소스 스크립트
트레이딩뷰의 진정한 정신에 따라, 이 스크립트의 작성자는 이를 오픈소스로 공개하여 트레이더들이 기능을 검토하고 검증할 수 있도록 했습니다. 작성자에게 찬사를 보냅니다! 이 코드는 무료로 사용할 수 있지만, 코드를 재게시하는 경우 하우스 룰이 적용된다는 점을 기억하세요.

면책사항
해당 정보와 게시물은 금융, 투자, 트레이딩 또는 기타 유형의 조언이나 권장 사항으로 간주되지 않으며, 트레이딩뷰에서 제공하거나 보증하는 것이 아닙니다. 자세한 내용은 이용 약관을 참조하세요.
오픈 소스 스크립트
트레이딩뷰의 진정한 정신에 따라, 이 스크립트의 작성자는 이를 오픈소스로 공개하여 트레이더들이 기능을 검토하고 검증할 수 있도록 했습니다. 작성자에게 찬사를 보냅니다! 이 코드는 무료로 사용할 수 있지만, 코드를 재게시하는 경우 하우스 룰이 적용된다는 점을 기억하세요.
면책사항
해당 정보와 게시물은 금융, 투자, 트레이딩 또는 기타 유형의 조언이나 권장 사항으로 간주되지 않으며, 트레이딩뷰에서 제공하거나 보증하는 것이 아닙니다. 자세한 내용은 이용 약관을 참조하세요.