OPEN-SOURCE SCRIPT
Range Percentile Bias
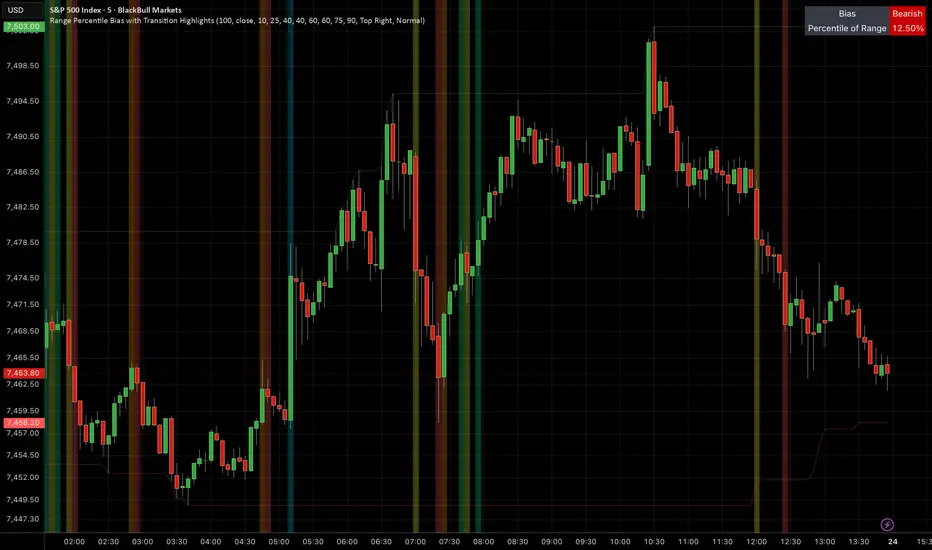
Range Percentile Bias with Transition Highlights
Range Percentile Bias with Transition Highlights is designed to evaluate where current price sits within a historical price range and translate that positioning into an easy-to-read directional bias framework.
Rather than using traditional trend or momentum calculations, this indicator analyzes the current price location relative to the highest high and lowest low over a user-defined lookback period. The goal is to provide a quick assessment of whether price is trading near the lower, middle, or upper portions of its recent range and classify that positioning into market bias categories. Built from the functionality and logic contained within your indicator.
Features
• Configurable lookback range period
• Percentile-based bias classification
• Adjustable bullish and bearish threshold levels
• Neutral zone customization
• Transition highlight system
• Lookback high and low visual references
• Dynamic summary table
• Table position customization
• Table size customization
• Custom color settings
• Transition alerts
Bias States
🟢 Very Bullish
Price is positioned near the upper extreme of the recent range.
🟢 Bullish
Price is trading within stronger bullish territory.
🟢 Slightly Bullish
Price shows moderate bullish positioning.
⚪ Neutral
Price remains within the defined balanced range.
🔴 Slightly Bearish
Price begins showing weaker relative positioning.
🔴 Bearish
Price moves toward stronger bearish territory.
🔴 Very Bearish
Price is positioned near the lower extreme of the recent range.
Transition Highlights
The indicator can visually highlight changes between larger market states:
🟨 Bullish → Neutral
🟩 Neutral → Bullish
🟧 Bearish → Neutral
🟥 Neutral → Bearish
🟪 Bullish → Bearish
🟦 Bearish → Bullish
These transitions are intended to make shifts in market behavior easier to identify without constantly monitoring percentile values.
Summary Table Includes
• Current Bias
• Current Range Percentile
Potential Use Cases
• Identify relative market positioning
• Determine bullish or bearish context
• Monitor changing market conditions
• Filter trade setups
• Identify transition periods
• Add confluence to existing systems
• Study range behavior over time
Settings Guide
High/Low Lookback Period
Controls how many historical bars are used to define the current range.
Current Price Source
Determines which price value is used for calculations.
Bias Percentile Levels
Controls where bullish, bearish, and neutral zones begin and end.
Neutral Zone
Defines the balanced area between bullish and bearish conditions.
Transition Highlights
Displays visual highlights when larger market state changes occur.
Table Position / Text Size
Adjusts dashboard placement and readability.
Alerts Included
• Very Bullish Bias
• Bullish Bias
• Slightly Bullish Bias
• Neutral Bias
• Slightly Bearish Bias
• Bearish Bias
• Very Bearish Bias
• Bullish → Neutral Transition
• Neutral → Bullish Transition
• Bearish → Neutral Transition
• Neutral → Bearish Transition
• Bullish → Bearish Transition
• Bearish → Bullish Transition
About TrendGenY Indicators
TrendGenY indicators are built from market experience, creative concepts, and a constant pursuit of unique perspectives. Rather than following conventional ideas, the focus is on uncovering alternative insights and viewing market behavior through different angles to reveal information that traditional tools may overlook and help traders build a more meaningful edge in the market.
Range Percentile Bias with Transition Highlights is designed to evaluate where current price sits within a historical price range and translate that positioning into an easy-to-read directional bias framework.
Rather than using traditional trend or momentum calculations, this indicator analyzes the current price location relative to the highest high and lowest low over a user-defined lookback period. The goal is to provide a quick assessment of whether price is trading near the lower, middle, or upper portions of its recent range and classify that positioning into market bias categories. Built from the functionality and logic contained within your indicator.
Features
• Configurable lookback range period
• Percentile-based bias classification
• Adjustable bullish and bearish threshold levels
• Neutral zone customization
• Transition highlight system
• Lookback high and low visual references
• Dynamic summary table
• Table position customization
• Table size customization
• Custom color settings
• Transition alerts
Bias States
🟢 Very Bullish
Price is positioned near the upper extreme of the recent range.
🟢 Bullish
Price is trading within stronger bullish territory.
🟢 Slightly Bullish
Price shows moderate bullish positioning.
⚪ Neutral
Price remains within the defined balanced range.
🔴 Slightly Bearish
Price begins showing weaker relative positioning.
🔴 Bearish
Price moves toward stronger bearish territory.
🔴 Very Bearish
Price is positioned near the lower extreme of the recent range.
Transition Highlights
The indicator can visually highlight changes between larger market states:
🟨 Bullish → Neutral
🟩 Neutral → Bullish
🟧 Bearish → Neutral
🟥 Neutral → Bearish
🟪 Bullish → Bearish
🟦 Bearish → Bullish
These transitions are intended to make shifts in market behavior easier to identify without constantly monitoring percentile values.
Summary Table Includes
• Current Bias
• Current Range Percentile
Potential Use Cases
• Identify relative market positioning
• Determine bullish or bearish context
• Monitor changing market conditions
• Filter trade setups
• Identify transition periods
• Add confluence to existing systems
• Study range behavior over time
Settings Guide
High/Low Lookback Period
Controls how many historical bars are used to define the current range.
Current Price Source
Determines which price value is used for calculations.
Bias Percentile Levels
Controls where bullish, bearish, and neutral zones begin and end.
Neutral Zone
Defines the balanced area between bullish and bearish conditions.
Transition Highlights
Displays visual highlights when larger market state changes occur.
Table Position / Text Size
Adjusts dashboard placement and readability.
Alerts Included
• Very Bullish Bias
• Bullish Bias
• Slightly Bullish Bias
• Neutral Bias
• Slightly Bearish Bias
• Bearish Bias
• Very Bearish Bias
• Bullish → Neutral Transition
• Neutral → Bullish Transition
• Bearish → Neutral Transition
• Neutral → Bearish Transition
• Bullish → Bearish Transition
• Bearish → Bullish Transition
About TrendGenY Indicators
TrendGenY indicators are built from market experience, creative concepts, and a constant pursuit of unique perspectives. Rather than following conventional ideas, the focus is on uncovering alternative insights and viewing market behavior through different angles to reveal information that traditional tools may overlook and help traders build a more meaningful edge in the market.
오픈 소스 스크립트
트레이딩뷰의 진정한 정신에 따라, 이 스크립트의 작성자는 이를 오픈소스로 공개하여 트레이더들이 기능을 검토하고 검증할 수 있도록 했습니다. 작성자에게 찬사를 보냅니다! 이 코드는 무료로 사용할 수 있지만, 코드를 재게시하는 경우 하우스 룰이 적용된다는 점을 기억하세요.

면책사항
해당 정보와 게시물은 금융, 투자, 트레이딩 또는 기타 유형의 조언이나 권장 사항으로 간주되지 않으며, 트레이딩뷰에서 제공하거나 보증하는 것이 아닙니다. 자세한 내용은 이용 약관을 참조하세요.
오픈 소스 스크립트
트레이딩뷰의 진정한 정신에 따라, 이 스크립트의 작성자는 이를 오픈소스로 공개하여 트레이더들이 기능을 검토하고 검증할 수 있도록 했습니다. 작성자에게 찬사를 보냅니다! 이 코드는 무료로 사용할 수 있지만, 코드를 재게시하는 경우 하우스 룰이 적용된다는 점을 기억하세요.
면책사항
해당 정보와 게시물은 금융, 투자, 트레이딩 또는 기타 유형의 조언이나 권장 사항으로 간주되지 않으며, 트레이딩뷰에서 제공하거나 보증하는 것이 아닙니다. 자세한 내용은 이용 약관을 참조하세요.