OPEN-SOURCE SCRIPT
Volatility Flow & Cycle Divergences
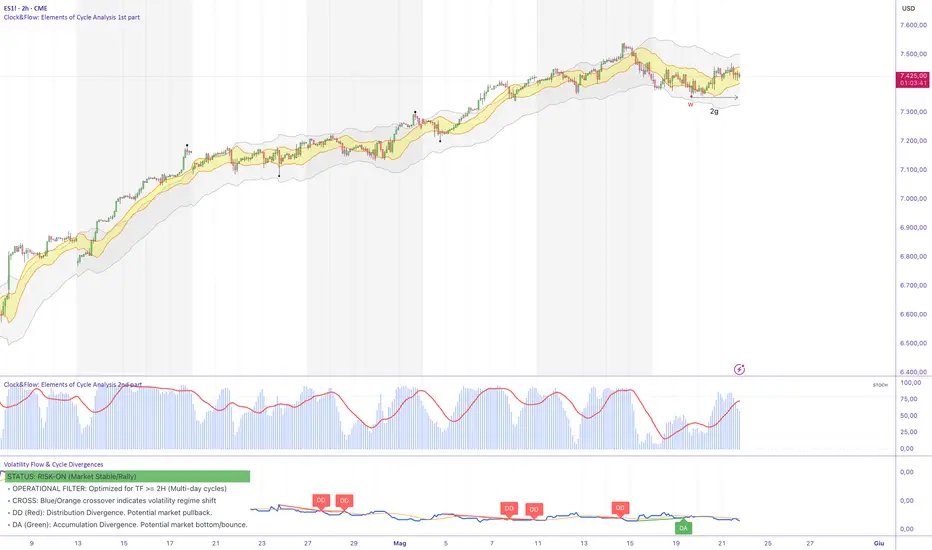
Volatility Flow & Cycle Divergences
General Description
Volatility Flow & Cycle Divergences is an intermarket quantitative analysis tool designed to map liquidity flows, risk regimes, and structural anomalies between the US stock market (S&P 500 / ES) and the options market, represented by the CBOE Volatility Index (VIX).
The indicator is built on the premise that the physiological relationship between the S&P 500 and the VIX is historically inverse (moving in opposite directions roughly 80% of the time). This script does not merely calculate the raw ratio between the two assets; it mathematically isolates the rare moments of monetary asynchrony where this correlation breaks down. These anomalies are frequently the precursors to lasting cyclical reversals or the exhaustion of the primary trend.
Core Features and Filtering Logic
To overcome the issue of false signals typical of traditional oscillators on intermediate timeframes, the script integrates three concurrent proprietary filters:
Intermarket Relative Strength Ratio (VIX/SPX): It calculates the relative speed between the demand for protective insurance (Put options) and the spot price of the equity basket.
Asymmetric Cyclical Pivot Filter: The algorithm for detecting relative highs and lows uses an asymmetric lookback/lookahead range (calibrated by default to 8 periods on the left and 5 on the right). This isolates true macro turning points and eliminates microscopic, temporary intraday spikes.
Momentum Validation (Anti-Inertia Filter): Divergences are not generated purely on a mathematical basis. A divergence on market highs is validated only if the S&P 500 is in a true zone of strength/overbought territory (RSI > 55), while a divergence on market lows requires actual panic selling pressure (RSI < 45). If the market is in a neutral congestion phase, the signal is discarded at the source.
Algorithmic Transparency (Under the Hood)
The indicator executes its analysis by processing three integrated algorithmic engines within the code:
Geometric Pivot Algorithm (ta.pivothigh/low): Constantly scans the historical series of the VIX/SPX Ratio to isolate cyclical peaks and troughs, validating them only if they are surrounded by a precise asymmetry of bar-index (8 to the left, 5 to the right).
Momentum Algorithm (Wilder's RSI): Monitors the first derivative of the S&P 500 price. It does not calculate the classic relative strength on the Ratio itself, but uses the RSI algorithm on the underlying equity index to act as a logical switch (Gatekeeper) for the signals.
Pattern Matching Algorithm (Conditional Logic): A conditional control structure that crosses the spatial-temporal coordinates of price pivots with those of volatility, filtering out false signals based on overbought/oversold regimes.
How to Read the Signals on the Chart
The script provides a clean graphical visualization using compact "badges" on the lower panel so it does not obscure the price action:
DD (Distribution Divergence - Red): The S&P 500 prints a new relative high, but the VIX/SPX Ratio shows a higher low or an anomalous support. This means that despite the price rally, institutional investors are accumulating protective hedges due to an ongoing distribution. Potential pullback ahead.
DA (Accumulation Divergence - Green): The S&P 500 updates its period lows amid panic, but the Ratio registers a lower peak compared to the previous one. Implied volatility pressure is exhausting: "smart money" is stopping the hedging process and beginning to accumulate spot positions. Potential cyclical low/bounce in formation.
User Interface (UI) Elements
Integrated Information Dashboard: Positioned at the bottom left with a transparent background to preserve chart real estate. It shows the real-time macro state of the market (RISK-ON or RISK-OFF) based on the position of the Ratio relative to its 20-period moving average, serving as an operational reminder for the divergence rules.
View Toggle: Through the indicator settings panel, you can hide or show the dashboard with a single click.
Operational Advice and Timeframes
This indicator expresses its maximum performance when integrated into a cyclical and multi-day flow analysis logic:
Best Timeframe: 2 Hours (2H) to capture operational swings and cycles lasting 2-3 days.
Macro / Swing Analysis: Daily (1D) to map structural medium-to-long term risk regimes.
Technical Note: We advise against using this on fast timeframes (below the 2-hour chart) due to the algorithmic noise generated by short-term option expirations (0DTE) and the lack of reliable spot VIX calculation during overnight sessions (Globex).
Important Disclaimer & Operational Risk Warning
Critical Note: Never use a single indicator to make standalone trading decisions. Always contextualize what the indicator suggests within a broader market framework and combine it with other validation techniques (e.g., Price Action, Market Structure, Volume Profile, or Order Flow). No indicator is infallible, and intermarket divergences represent shifts in probability, not guaranteed certainties.
Italiano
Descrizione Generale
Volatility Flow & Cycle Divergences è uno strumento di analisi intermarket quantitativa progettato per mappare i flussi di liquidità, i regimi di rischio e le anomalie strutturali tra il mercato azionario statunitense (S&P 500 / ES) e il mercato delle opzioni, rappresentato dal CBOE Volatility Index (VIX).
L'indicatore si basa sul presupposto che la relazione fisiologica tra l'S&P 500 e il VIX sia storicamente inversa (circa l'80% delle volte si muovono in direzioni opposte). Questo script non si limita a calcolare il rapporto puro tra i due asset, ma isola matematicamente i rari momenti di asincronia monetaria, in cui questa correlazione si spezza. Tali anomalie sono spesso il precursore di inversioni cicliche durature o di esaurimenti del trend principale.
Caratteristiche Principali e Logica di Filtraggio
Per superare il problema dei falsi segnali tipici degli oscillatori tradizionali sui timeframe intermedi, lo script integra tre filtri proprietari concorrenti:
Rapporto di Forza Relativa Intermarket (VVIX/SPX$):
Calcola la velocità relativa tra la domanda di coperture assicurative (opzioni Put) e il prezzo spot del paniere azionario.
Filtro Ciclico Asimmetrico sui Pivot:
L'algoritmo di rilevamento dei massimi e minimi relativi utilizza un raggio d'azione asimmetrico (calibrato di default a 8 periodi a sinistra e 5 a destra). Questo isola i reali punti di svolta macro ed elimina i microscopici spike estemporanei intra-day.
Validazione del Momentum (Filtro Anti-Inerzia):
Le divergenze non vengono generate su base puramente matematica. Una divergenza sui massimi viene convalidata solo se l'S&P 500 si trova in una reale zona di ipercomprato/forza relativa (RSI > 55), mentre una sui minimi esige una reale pressione di panico (RSI < 45). Se il mercato si trova in una fase di congestione neutra, il segnale viene scartato all'origine.
Come Leggere i Segnali sul Grafico
Lo script restituisce una visualizzazione grafica pulita mediante "badge" compatti sul pannello inferiore per non occultare l'azione del prezzo:
DD (Divergenza di Distribuzione - Rossa): L'S&P 500 stampa un nuovo massimo relativo, ma il Ratio VIX/SPX mostra un minimo crescente o un supporto anomalo. Significa che, nonostante il rialzo del prezzo, gli investitori istituzionali stanno accumulando coperture protettive a causa di una distribuzione in corso. Potenziale storno in arrivo.
DA (Divergenza di Accumulazione - Verde): L'S&P 500 aggiorna i minimi di periodo nel panico, ma il Ratio fa registrare un picco inferiore rispetto al precedente. La pressione della volatilità implicita si sta esaurendo: le "mani forti" smettono di proteggersi e iniziano ad accumulare posizioni spot. Potenziale minimo ciclico/rimbalzo in formazione.
Elementi di Interfaccia Utente (UI)
Dashboard Informativa Integrata:
Posizionata in basso a sinistra con uno sfondo trasparente per preservare il chart real estate. Mostra in tempo reale lo stato macro del mercato (RISK-ON o RISK-OFF) in base alla posizione del Ratio rispetto alla sua media mobile a 20 periodi, fungendo da memorandum operativo per le regole di divergenza.
Interruttore di Vista: Tramite il pannello delle impostazioni è possibile nascondere o mostrare la dashboard con un solo clic.
Consigli Operativi e Timeframe
Questo indicatore esprime il massimo delle sue performance se integrato in una logica di analisi ciclica e di flusso plurigiornaliera:
Timeframe d'elezione: 2 Ore (2H) per catturare oscillazioni e cicli operativi di 2-3 giorni.
Analisi Macro / Swing: Giornaliero (1D) per mappare i regimi di rischio strutturali di medio-lungo termine.
Nota tecnica: Si sconsiglia l'utilizzo sui timeframe rapidi a causa del rumore algoritmico generato dalle scadenze opzioni a brevissimo termine (0DTE) e della mancanza di calcolo del VIX spot durante le sessioni notturne.
Avvertenza Importante e Rischio Operativo
Nota Critica: Non utilizzare mai un singolo indicatore per prendere decisioni operative autonome. Contestualizza sempre ciò che l'indicatore suggerisce all'interno di un quadro di mercato più ampio e combinalo con altre tecniche di validazione (ad es. Price Action, Struttura di Mercato, Volume Profile o Order Flow). Nessun indicatore è infallibile e le divergenze intermarket rappresentano variazioni nelle probabilità, non certezze garantite.
General Description
Volatility Flow & Cycle Divergences is an intermarket quantitative analysis tool designed to map liquidity flows, risk regimes, and structural anomalies between the US stock market (S&P 500 / ES) and the options market, represented by the CBOE Volatility Index (VIX).
The indicator is built on the premise that the physiological relationship between the S&P 500 and the VIX is historically inverse (moving in opposite directions roughly 80% of the time). This script does not merely calculate the raw ratio between the two assets; it mathematically isolates the rare moments of monetary asynchrony where this correlation breaks down. These anomalies are frequently the precursors to lasting cyclical reversals or the exhaustion of the primary trend.
Core Features and Filtering Logic
To overcome the issue of false signals typical of traditional oscillators on intermediate timeframes, the script integrates three concurrent proprietary filters:
Intermarket Relative Strength Ratio (VIX/SPX): It calculates the relative speed between the demand for protective insurance (Put options) and the spot price of the equity basket.
Asymmetric Cyclical Pivot Filter: The algorithm for detecting relative highs and lows uses an asymmetric lookback/lookahead range (calibrated by default to 8 periods on the left and 5 on the right). This isolates true macro turning points and eliminates microscopic, temporary intraday spikes.
Momentum Validation (Anti-Inertia Filter): Divergences are not generated purely on a mathematical basis. A divergence on market highs is validated only if the S&P 500 is in a true zone of strength/overbought territory (RSI > 55), while a divergence on market lows requires actual panic selling pressure (RSI < 45). If the market is in a neutral congestion phase, the signal is discarded at the source.
Algorithmic Transparency (Under the Hood)
The indicator executes its analysis by processing three integrated algorithmic engines within the code:
Geometric Pivot Algorithm (ta.pivothigh/low): Constantly scans the historical series of the VIX/SPX Ratio to isolate cyclical peaks and troughs, validating them only if they are surrounded by a precise asymmetry of bar-index (8 to the left, 5 to the right).
Momentum Algorithm (Wilder's RSI): Monitors the first derivative of the S&P 500 price. It does not calculate the classic relative strength on the Ratio itself, but uses the RSI algorithm on the underlying equity index to act as a logical switch (Gatekeeper) for the signals.
Pattern Matching Algorithm (Conditional Logic): A conditional control structure that crosses the spatial-temporal coordinates of price pivots with those of volatility, filtering out false signals based on overbought/oversold regimes.
How to Read the Signals on the Chart
The script provides a clean graphical visualization using compact "badges" on the lower panel so it does not obscure the price action:
DD (Distribution Divergence - Red): The S&P 500 prints a new relative high, but the VIX/SPX Ratio shows a higher low or an anomalous support. This means that despite the price rally, institutional investors are accumulating protective hedges due to an ongoing distribution. Potential pullback ahead.
DA (Accumulation Divergence - Green): The S&P 500 updates its period lows amid panic, but the Ratio registers a lower peak compared to the previous one. Implied volatility pressure is exhausting: "smart money" is stopping the hedging process and beginning to accumulate spot positions. Potential cyclical low/bounce in formation.
User Interface (UI) Elements
Integrated Information Dashboard: Positioned at the bottom left with a transparent background to preserve chart real estate. It shows the real-time macro state of the market (RISK-ON or RISK-OFF) based on the position of the Ratio relative to its 20-period moving average, serving as an operational reminder for the divergence rules.
View Toggle: Through the indicator settings panel, you can hide or show the dashboard with a single click.
Operational Advice and Timeframes
This indicator expresses its maximum performance when integrated into a cyclical and multi-day flow analysis logic:
Best Timeframe: 2 Hours (2H) to capture operational swings and cycles lasting 2-3 days.
Macro / Swing Analysis: Daily (1D) to map structural medium-to-long term risk regimes.
Technical Note: We advise against using this on fast timeframes (below the 2-hour chart) due to the algorithmic noise generated by short-term option expirations (0DTE) and the lack of reliable spot VIX calculation during overnight sessions (Globex).
Important Disclaimer & Operational Risk Warning
Critical Note: Never use a single indicator to make standalone trading decisions. Always contextualize what the indicator suggests within a broader market framework and combine it with other validation techniques (e.g., Price Action, Market Structure, Volume Profile, or Order Flow). No indicator is infallible, and intermarket divergences represent shifts in probability, not guaranteed certainties.
Italiano
Descrizione Generale
Volatility Flow & Cycle Divergences è uno strumento di analisi intermarket quantitativa progettato per mappare i flussi di liquidità, i regimi di rischio e le anomalie strutturali tra il mercato azionario statunitense (S&P 500 / ES) e il mercato delle opzioni, rappresentato dal CBOE Volatility Index (VIX).
L'indicatore si basa sul presupposto che la relazione fisiologica tra l'S&P 500 e il VIX sia storicamente inversa (circa l'80% delle volte si muovono in direzioni opposte). Questo script non si limita a calcolare il rapporto puro tra i due asset, ma isola matematicamente i rari momenti di asincronia monetaria, in cui questa correlazione si spezza. Tali anomalie sono spesso il precursore di inversioni cicliche durature o di esaurimenti del trend principale.
Caratteristiche Principali e Logica di Filtraggio
Per superare il problema dei falsi segnali tipici degli oscillatori tradizionali sui timeframe intermedi, lo script integra tre filtri proprietari concorrenti:
Rapporto di Forza Relativa Intermarket (VVIX/SPX$):
Calcola la velocità relativa tra la domanda di coperture assicurative (opzioni Put) e il prezzo spot del paniere azionario.
Filtro Ciclico Asimmetrico sui Pivot:
L'algoritmo di rilevamento dei massimi e minimi relativi utilizza un raggio d'azione asimmetrico (calibrato di default a 8 periodi a sinistra e 5 a destra). Questo isola i reali punti di svolta macro ed elimina i microscopici spike estemporanei intra-day.
Validazione del Momentum (Filtro Anti-Inerzia):
Le divergenze non vengono generate su base puramente matematica. Una divergenza sui massimi viene convalidata solo se l'S&P 500 si trova in una reale zona di ipercomprato/forza relativa (RSI > 55), mentre una sui minimi esige una reale pressione di panico (RSI < 45). Se il mercato si trova in una fase di congestione neutra, il segnale viene scartato all'origine.
Come Leggere i Segnali sul Grafico
Lo script restituisce una visualizzazione grafica pulita mediante "badge" compatti sul pannello inferiore per non occultare l'azione del prezzo:
DD (Divergenza di Distribuzione - Rossa): L'S&P 500 stampa un nuovo massimo relativo, ma il Ratio VIX/SPX mostra un minimo crescente o un supporto anomalo. Significa che, nonostante il rialzo del prezzo, gli investitori istituzionali stanno accumulando coperture protettive a causa di una distribuzione in corso. Potenziale storno in arrivo.
DA (Divergenza di Accumulazione - Verde): L'S&P 500 aggiorna i minimi di periodo nel panico, ma il Ratio fa registrare un picco inferiore rispetto al precedente. La pressione della volatilità implicita si sta esaurendo: le "mani forti" smettono di proteggersi e iniziano ad accumulare posizioni spot. Potenziale minimo ciclico/rimbalzo in formazione.
Elementi di Interfaccia Utente (UI)
Dashboard Informativa Integrata:
Posizionata in basso a sinistra con uno sfondo trasparente per preservare il chart real estate. Mostra in tempo reale lo stato macro del mercato (RISK-ON o RISK-OFF) in base alla posizione del Ratio rispetto alla sua media mobile a 20 periodi, fungendo da memorandum operativo per le regole di divergenza.
Interruttore di Vista: Tramite il pannello delle impostazioni è possibile nascondere o mostrare la dashboard con un solo clic.
Consigli Operativi e Timeframe
Questo indicatore esprime il massimo delle sue performance se integrato in una logica di analisi ciclica e di flusso plurigiornaliera:
Timeframe d'elezione: 2 Ore (2H) per catturare oscillazioni e cicli operativi di 2-3 giorni.
Analisi Macro / Swing: Giornaliero (1D) per mappare i regimi di rischio strutturali di medio-lungo termine.
Nota tecnica: Si sconsiglia l'utilizzo sui timeframe rapidi a causa del rumore algoritmico generato dalle scadenze opzioni a brevissimo termine (0DTE) e della mancanza di calcolo del VIX spot durante le sessioni notturne.
Avvertenza Importante e Rischio Operativo
Nota Critica: Non utilizzare mai un singolo indicatore per prendere decisioni operative autonome. Contestualizza sempre ciò che l'indicatore suggerisce all'interno di un quadro di mercato più ampio e combinalo con altre tecniche di validazione (ad es. Price Action, Struttura di Mercato, Volume Profile o Order Flow). Nessun indicatore è infallibile e le divergenze intermarket rappresentano variazioni nelle probabilità, non certezze garantite.
오픈 소스 스크립트
트레이딩뷰의 진정한 정신에 따라, 이 스크립트의 작성자는 이를 오픈소스로 공개하여 트레이더들이 기능을 검토하고 검증할 수 있도록 했습니다. 작성자에게 찬사를 보냅니다! 이 코드는 무료로 사용할 수 있지만, 코드를 재게시하는 경우 하우스 룰이 적용된다는 점을 기억하세요.

면책사항
해당 정보와 게시물은 금융, 투자, 트레이딩 또는 기타 유형의 조언이나 권장 사항으로 간주되지 않으며, 트레이딩뷰에서 제공하거나 보증하는 것이 아닙니다. 자세한 내용은 이용 약관을 참조하세요.
오픈 소스 스크립트
트레이딩뷰의 진정한 정신에 따라, 이 스크립트의 작성자는 이를 오픈소스로 공개하여 트레이더들이 기능을 검토하고 검증할 수 있도록 했습니다. 작성자에게 찬사를 보냅니다! 이 코드는 무료로 사용할 수 있지만, 코드를 재게시하는 경우 하우스 룰이 적용된다는 점을 기억하세요.
면책사항
해당 정보와 게시물은 금융, 투자, 트레이딩 또는 기타 유형의 조언이나 권장 사항으로 간주되지 않으며, 트레이딩뷰에서 제공하거나 보증하는 것이 아닙니다. 자세한 내용은 이용 약관을 참조하세요.