OPEN-SOURCE SCRIPT
TWR Composite
Smart move publishing it open-source — let people build their own signals on top of a clean base.
Here's the description, then tags, then a few publishing tips.
Description
TWR Composite — Weighted Momentum Oscillator with Gradient Midline Fill
TWR Composite blends six classical momentum measures into a single normalized oscillator: RSI, CCI, OBV-momentum, Stochastic %K, MFI, and the Awesome Oscillator. Each component is individually weighted (all adjustable) and normalized to a common 0–1 range, then lightly smoothed. The result is one line that summarizes momentum across several independent lenses instead of forcing you to read multiple panes.
Component handling
Each input is normalized so the composite stays bounded between 0 and 1, regardless of asset or timeframe:
RSI, Stochastic %K, and MFI are divided by 100.
CCI (which is unbounded) is soft-clipped via a tanh function. The clip scale is configurable.
OBV is cumulative by nature, so the indicator normalizes its N-bar change over a rolling 100-bar range rather than the raw cumulative value.
The Awesome Oscillator is also normalized against its rolling 100-bar range.
The six normalized components are combined using your weights, then smoothed with a short SMA to filter single-bar noise. Set any weight to zero to remove that component entirely.
Visualization
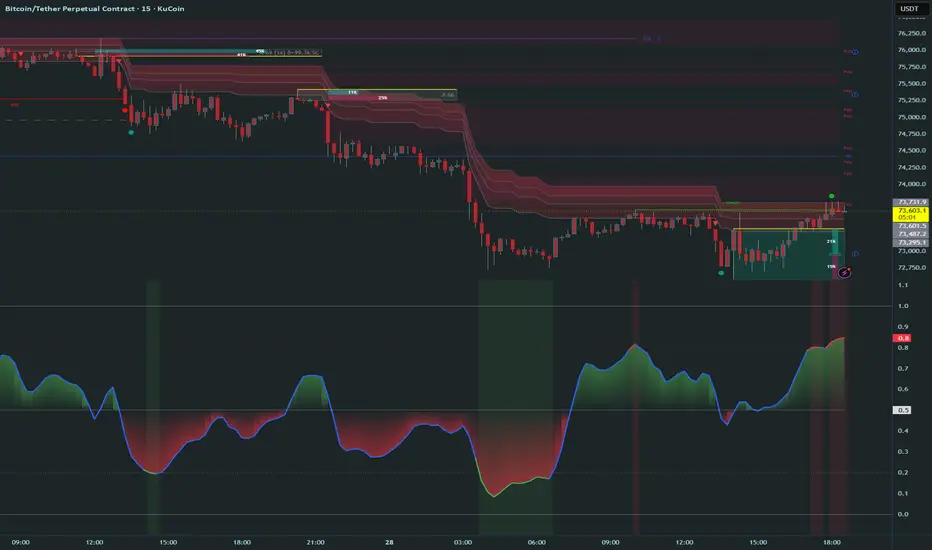
The composite plots with a gradient fill anchored between the line and the 0.5 midline — opaque at the line, fading toward the midline. The hue flips automatically: green when the composite is above 0.5, red when below. Configurable overbought and oversold levels (default 0.8 / 0.2) are drawn as dotted reference lines, with optional background shading when the composite enters those zones.
Optional layers (default off)
Fib levels on price: an ATR-trailing stop tracks the prevailing swing, and three retracement levels (61.8 / 78.6 / 88.6 by default) are projected from the swing extreme back toward the trail. Useful as confluence reference points with the composite.
Regime line: an SMA of the composite itself, drawn alongside a configurable reference line, to give you a slower read on overall momentum bias.
What this is and isn't
This is a visualization tool. It does not generate buy/sell signals, does not have alerts, and does not claim any edge. It's a clean way to see multi-component momentum on one line, with the visual contrast strong enough to read at a glance. Use it as a building block — pair it with your own entries, divergence detection, signal logic, or whatever fits your system.
The code is open. Fork it, modify it, build signals on top of it.
works very well with the Precision Pulse 8 indicator
Disclaimer:
This indicator is provided for educational and informational purposes only. It is a visualization of mathematical relationships between common momentum components — nothing more. It does not constitute financial, investment, or trading advice, and no part of it should be interpreted as a recommendation to buy, sell, or hold any asset.Past behavior of any indicator is not indicative of future results. Trading and investing carry substantial risk, including the risk of total loss. You alone are responsible for your decisions, your risk management, and any outcomes. Always do your own research and consult a licensed professional before acting on any market information.By using this script you acknowledge that the author makes no representation or warranty regarding its accuracy, completeness, or fitness for any particular purpose, and accepts no liability for any losses or damages arising from its use.
good luck trading.
Here's the description, then tags, then a few publishing tips.
Description
TWR Composite — Weighted Momentum Oscillator with Gradient Midline Fill
TWR Composite blends six classical momentum measures into a single normalized oscillator: RSI, CCI, OBV-momentum, Stochastic %K, MFI, and the Awesome Oscillator. Each component is individually weighted (all adjustable) and normalized to a common 0–1 range, then lightly smoothed. The result is one line that summarizes momentum across several independent lenses instead of forcing you to read multiple panes.
Component handling
Each input is normalized so the composite stays bounded between 0 and 1, regardless of asset or timeframe:
RSI, Stochastic %K, and MFI are divided by 100.
CCI (which is unbounded) is soft-clipped via a tanh function. The clip scale is configurable.
OBV is cumulative by nature, so the indicator normalizes its N-bar change over a rolling 100-bar range rather than the raw cumulative value.
The Awesome Oscillator is also normalized against its rolling 100-bar range.
The six normalized components are combined using your weights, then smoothed with a short SMA to filter single-bar noise. Set any weight to zero to remove that component entirely.
Visualization
The composite plots with a gradient fill anchored between the line and the 0.5 midline — opaque at the line, fading toward the midline. The hue flips automatically: green when the composite is above 0.5, red when below. Configurable overbought and oversold levels (default 0.8 / 0.2) are drawn as dotted reference lines, with optional background shading when the composite enters those zones.
Optional layers (default off)
Fib levels on price: an ATR-trailing stop tracks the prevailing swing, and three retracement levels (61.8 / 78.6 / 88.6 by default) are projected from the swing extreme back toward the trail. Useful as confluence reference points with the composite.
Regime line: an SMA of the composite itself, drawn alongside a configurable reference line, to give you a slower read on overall momentum bias.
What this is and isn't
This is a visualization tool. It does not generate buy/sell signals, does not have alerts, and does not claim any edge. It's a clean way to see multi-component momentum on one line, with the visual contrast strong enough to read at a glance. Use it as a building block — pair it with your own entries, divergence detection, signal logic, or whatever fits your system.
The code is open. Fork it, modify it, build signals on top of it.
works very well with the Precision Pulse 8 indicator
Disclaimer:
This indicator is provided for educational and informational purposes only. It is a visualization of mathematical relationships between common momentum components — nothing more. It does not constitute financial, investment, or trading advice, and no part of it should be interpreted as a recommendation to buy, sell, or hold any asset.Past behavior of any indicator is not indicative of future results. Trading and investing carry substantial risk, including the risk of total loss. You alone are responsible for your decisions, your risk management, and any outcomes. Always do your own research and consult a licensed professional before acting on any market information.By using this script you acknowledge that the author makes no representation or warranty regarding its accuracy, completeness, or fitness for any particular purpose, and accepts no liability for any losses or damages arising from its use.
good luck trading.
오픈 소스 스크립트
트레이딩뷰의 진정한 정신에 따라, 이 스크립트의 작성자는 이를 오픈소스로 공개하여 트레이더들이 기능을 검토하고 검증할 수 있도록 했습니다. 작성자에게 찬사를 보냅니다! 이 코드는 무료로 사용할 수 있지만, 코드를 재게시하는 경우 하우스 룰이 적용된다는 점을 기억하세요.

D' Rebellionaire
Precision Pulse Team | Belgium HQ
Markets bend. I don’t.
Precision Pulse Team | Belgium HQ
Markets bend. I don’t.
면책사항
해당 정보와 게시물은 금융, 투자, 트레이딩 또는 기타 유형의 조언이나 권장 사항으로 간주되지 않으며, 트레이딩뷰에서 제공하거나 보증하는 것이 아닙니다. 자세한 내용은 이용 약관을 참조하세요.
오픈 소스 스크립트
트레이딩뷰의 진정한 정신에 따라, 이 스크립트의 작성자는 이를 오픈소스로 공개하여 트레이더들이 기능을 검토하고 검증할 수 있도록 했습니다. 작성자에게 찬사를 보냅니다! 이 코드는 무료로 사용할 수 있지만, 코드를 재게시하는 경우 하우스 룰이 적용된다는 점을 기억하세요.
D' Rebellionaire
Precision Pulse Team | Belgium HQ
Markets bend. I don’t.
Precision Pulse Team | Belgium HQ
Markets bend. I don’t.
면책사항
해당 정보와 게시물은 금융, 투자, 트레이딩 또는 기타 유형의 조언이나 권장 사항으로 간주되지 않으며, 트레이딩뷰에서 제공하거나 보증하는 것이 아닙니다. 자세한 내용은 이용 약관을 참조하세요.