PINE LIBRARY
업데이트됨 MonthlyPerformanceV2
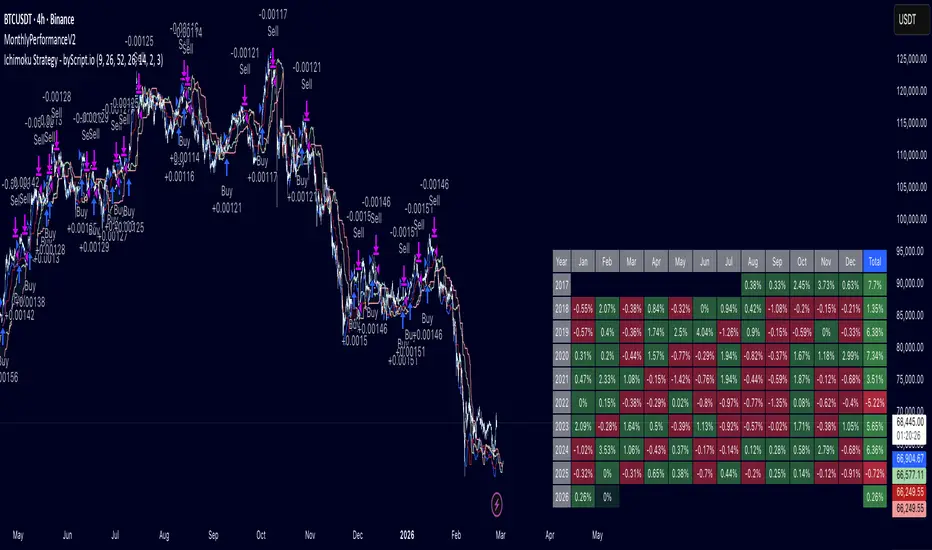
This library provides a plug-and-play monthly performance table for strategy scripts.
It automatically tracks and displays profit/loss per month and year directly on your chart.
─────────────────────────────────────
🔧 FUNCTION
─────────────────────────────────────
trackAndDraw(initialCapital, showInPercentage)
Parameters:
- initialCapital (float) — The starting capital of your strategy.
Tip: use `strategy.initial_capital` for automatic sync.
- showInPercentage (bool) — Display mode:
`true` → shows monthly result in % (compounding)
`false` → shows monthly result in USD (normalized to initial capital)
─────────────────────────────────────
📊 FEATURES
─────────────────────────────────────
- Compounding % calculation per month and per year
- Dual display mode: percentage or USD equivalent
- Color-coded cells (green / red) for quick visual reading
- Running month tracker (current open month, lighter color)
- Annual total column with compounding yearly return
- Auto-limits display to the 19 most recent years to prevent table overflow
─────────────────────────────────────
🚀 HOW TO USE
─────────────────────────────────────
add this 2 lines code to your script
import edwinardyanto/MonthlyPerformance/1 as mp
mp.trackAndDraw(strategy.initial_capital, true)
─────────────────────────────────────
📌 NOTES
─────────────────────────────────────
- Only compatible with strategy scripts (requires strategy.equity)
- Call trackAndDraw() once, outside any conditional block
- Table is displayed at bottom-right of the chart
- Older years beyond the 19-year limit are excluded from display
but still calculated internally
It automatically tracks and displays profit/loss per month and year directly on your chart.
─────────────────────────────────────
🔧 FUNCTION
─────────────────────────────────────
trackAndDraw(initialCapital, showInPercentage)
Parameters:
- initialCapital (float) — The starting capital of your strategy.
Tip: use `strategy.initial_capital` for automatic sync.
- showInPercentage (bool) — Display mode:
`true` → shows monthly result in % (compounding)
`false` → shows monthly result in USD (normalized to initial capital)
─────────────────────────────────────
📊 FEATURES
─────────────────────────────────────
- Compounding % calculation per month and per year
- Dual display mode: percentage or USD equivalent
- Color-coded cells (green / red) for quick visual reading
- Running month tracker (current open month, lighter color)
- Annual total column with compounding yearly return
- Auto-limits display to the 19 most recent years to prevent table overflow
─────────────────────────────────────
🚀 HOW TO USE
─────────────────────────────────────
add this 2 lines code to your script
import edwinardyanto/MonthlyPerformance/1 as mp
mp.trackAndDraw(strategy.initial_capital, true)
─────────────────────────────────────
📌 NOTES
─────────────────────────────────────
- Only compatible with strategy scripts (requires strategy.equity)
- Call trackAndDraw() once, outside any conditional block
- Table is displayed at bottom-right of the chart
- Older years beyond the 19-year limit are excluded from display
but still calculated internally
릴리즈 노트
v2better visual
파인 라이브러리
트레이딩뷰의 진정한 정신에 따라, 작성자는 이 파인 코드를 오픈소스 라이브러리로 게시하여 커뮤니티의 다른 파인 프로그래머들이 재사용할 수 있도록 했습니다. 작성자에게 경의를 표합니다! 이 라이브러리는 개인적으로 사용하거나 다른 오픈소스 게시물에서 사용할 수 있지만, 이 코드의 게시물 내 재사용은 하우스 룰에 따라 규제됩니다.

면책사항
해당 정보와 게시물은 금융, 투자, 트레이딩 또는 기타 유형의 조언이나 권장 사항으로 간주되지 않으며, 트레이딩뷰에서 제공하거나 보증하는 것이 아닙니다. 자세한 내용은 이용 약관을 참조하세요.
파인 라이브러리
트레이딩뷰의 진정한 정신에 따라, 작성자는 이 파인 코드를 오픈소스 라이브러리로 게시하여 커뮤니티의 다른 파인 프로그래머들이 재사용할 수 있도록 했습니다. 작성자에게 경의를 표합니다! 이 라이브러리는 개인적으로 사용하거나 다른 오픈소스 게시물에서 사용할 수 있지만, 이 코드의 게시물 내 재사용은 하우스 룰에 따라 규제됩니다.
면책사항
해당 정보와 게시물은 금융, 투자, 트레이딩 또는 기타 유형의 조언이나 권장 사항으로 간주되지 않으며, 트레이딩뷰에서 제공하거나 보증하는 것이 아닙니다. 자세한 내용은 이용 약관을 참조하세요.